Product Architecture
App product architecture
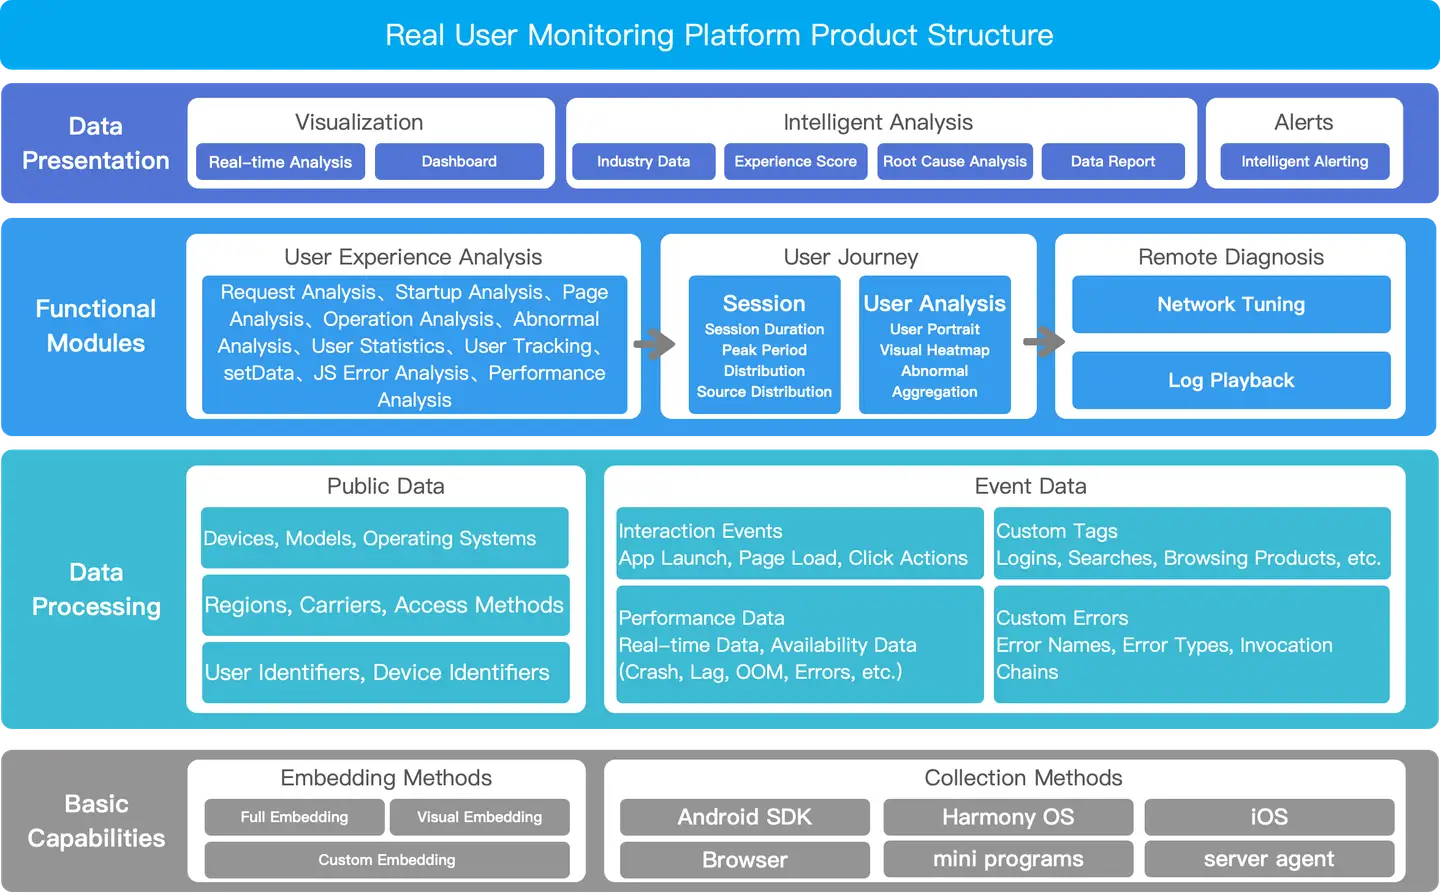
The App product consists of "App Rating", "Network Analysis", "User Experience Analysis", "Anomaly Analysis" and "User Tracking", as well as "User Statistics" and "Version Distribution", as well as "Remote Diagnostics", and "User Travel" and the "App Settings".
Explain: H5 page data in the App product will be displayed in the Web product.

Description of product functions
- Application list: It is composed of "Application Overview". Through the application list, you can understand the application rating, the number of active devices, user experience and availability.
- Network module: It is composed of four parts: "Request Analysis", "Key Request", "CDN Analysis" and "Protocol Extension". Through the network module, you can comprehensively analyze the response time and error rate of the application, as well as the node distribution and scheduling strategy of the CDN vendor, and evaluate the user experience of the application request. At the same time, you can analyze the public network quality of the client and compare and analyze the CDN selection.
- User experience: It consists of three parts: "Startup experience analysis", "Page experience analysis" and "Operation experience analysis." By analyzing the complete user use process of the application, the root causes of slow startup, inability to interact with the page, long waiting time for the first screen and no response when clicking the button are analyzed.
- Exception analysis: It consists of three parts: "crash", "stutter" and "custom error". It analyzes the problems affecting the application stability by collecting crash and stutter data, and collects "business error" by providing API interface.
- Exception tracking: All exception sample data of the user can be tracked by retrieving the "user unique identifier", and query and export of startup, operation, page, slow request, request error, crash, stutter and custom error are supported.
- Remote diagnosis: Through the remote diagnosis function, you can conduct network detection and log retrieval operations on real users, and further analyze the root causes of user abnormalities from the user's perspective.
- User statistics: By analyzing the number of new users, the number of active devices, the number of starts and the length of use, it provides the basic visual charts of "user trend analysis", "length of use analysis", "user dimension proportion" and "device number statistics".
- Version distribution: By analyzing the user experience scores of each version, it can assist developers in version management and provide comparative analysis of up to three versions.
- WebView (in-app): Collect user experience data of H5 pages by automatically injecting JS code, including: page loading time (average value), HTML loading, page rendering, visits (i.e. PV per minute, average value), JS error rate and Apdex index.
- User journey: By analyzing the session data of each user, you can understand the user operation path and view the session video (you need to turn on the control switch); through the "user analysis" function, you can understand the usage of each user, the session list and the abnormal problems encountered.