Exception Analysis
Anomaly analysis The module is used to view crashes, stutters, OOM, and custom error conditions for the selected App. Out Of Memory (OOM) refers to the existence of unrecoverable memory in the application system or the use of too much memory, which eventually makes the program running memory larger than the maximum memory provided, the program can not run, and the system prompts memory overflow.
Click Anomaly analysis in the left navigation bar to enter the exception analysis overview page to view the crash, stutter, OOM and custom error information of the whole and single sample in the current application.
Data card
Four data cards are displayed Overview of exception analysis above, namely crash, stutter, OOM and custom error.
-
The crash card shows the crash rate, number of starts, number of crashes, and number of crash-affected devices of the current application.
-
The stutter card displays the stutter rate, number of active devices, number of stutters, and number of stutter-affected devices of the current application.
-
The OOM card shows the memory overflow rate, the number of memory overflows, and the number of devices affected by memory overflows for the current application.
-
The Custom Error Card displays the currently applied error rate, number of active devices, number of custom errors, and number of devices affected by the error.
Click a data card with the mouse, and all charts below will display the corresponding data.
Explain: The data of stutter and custom error can still be uploaded after the monthly activity is used in excess.

Trend analysis
In the Trend analysis figure, according to the card, you can view the number of crashes/times of stuttering/times of OOM rate/custom error rate, device crash rate/device stuttering rate/device OOM rate, crash times/stuttering times/OOM times/custom error times and the trend affecting the number of devices. Click on the top right of the figure to switch. In the drop-down menu of application version in the upper left corner, select the version to be compared to view the trend comparison between versions. Only comparison between 2 versions is supported.

Top5 device model The list can help you see which devices have higher crash rates, stutter rates, or error rates for the current app. The list shows the top 5 device models by percentage. The list is sorted from low to high. The percentage depends on the data card above the click. The number of affected devices and the number of active devices under various device types are displayed after the percentage figure. Click the number of affected devices and the number of active devices on the top of the table to switch and view.
Top5 operating system The list can help you see which operating systems have a higher crash rate, stutter rate, or error rate for the current application. The list shows the top 5 operating systems by percentage. The list is sorted from low to high. The percentage depends on the data card you click above. The number of affected devices and the number of active devices under various operating systems are displayed after the percentage number. Click the number of affected devices and the number of active devices above the table to switch and view.
Version distribution The list can help you see which app versions have a higher crash rate, stutter rate, or error rate for your current app. The list shows the top 5 versions by percentage. The list is sorted from low to high by percentage. The percentage depends on the data card clicked above. The number of affected devices and the number of active devices in various versions are displayed after the percentage number. Click the number of affected devices and the number of active devices on the top of the table to switch and view.
Top5 channel The list can help you see in which channels (app markets that download app installation packages) the current app has a higher crash rate, stutter rate, or error rate. The list shows the top 5 channels by percentage. The list is sorted from low to high. The percentage depends on the data card above the click. The number of affected devices and the number of active devices under various channels are displayed after the percentage number. Click the number of affected devices and the number of active devices on the top of the table to switch and view.
Crash/Stutter/Exception List
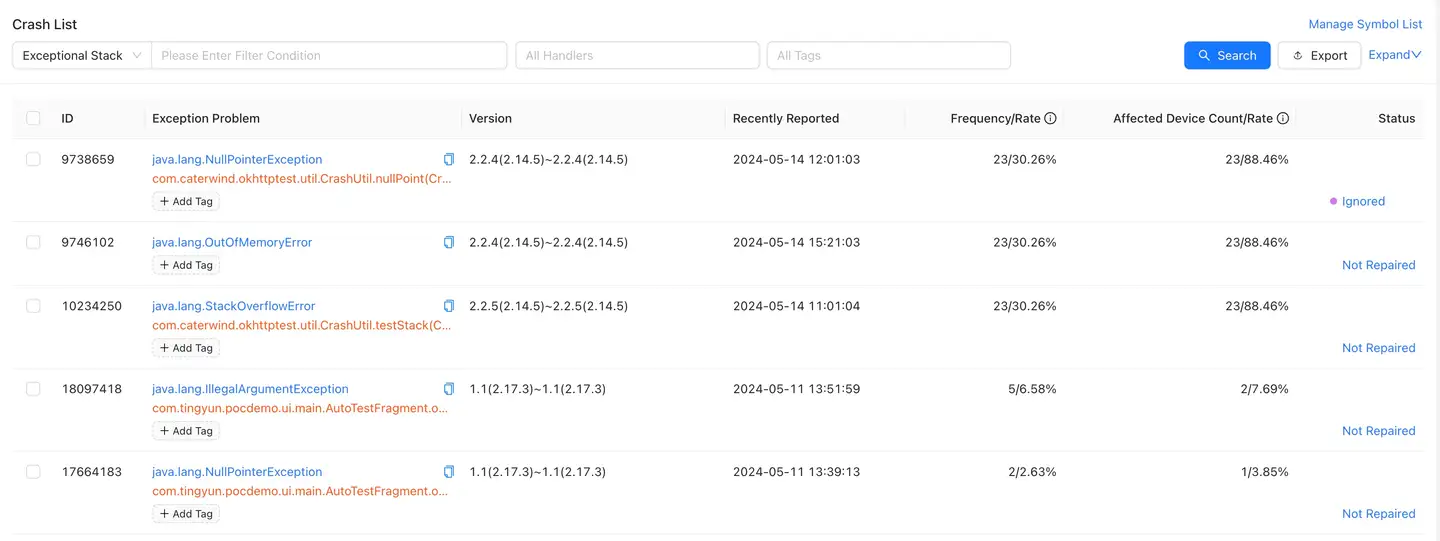
The crash list displays all crash event records of the current application. The stutter list displays all stutter event records of the current application, including custom errors and capture errors. The exception list displays all exception records of the current application. The content displayed in the list depends on the data card you select.
The three lists aggregate data by exception message and trace information to display exception ID, exception problem, App version, time of the latest reported exception, number of occurrences/percentage (number of exceptions of the current type/total number of exceptions), number/percentage of affected devices (number of affected devices of the current type/total number of affected devices) and status. Click the blue text link in the Exception column to drill to the Exception Details page. The list supports query based on handler, tag, exception handling status, exception stack, error type, platform type and exception name. The stutter list supports filtering based on main thread stutter and ANR. Under the exception problem, click Add tags the button to add a label to the current exception. Multiple exceptions can be added. After multiple questions are checked, the processing status can be modified in batch.
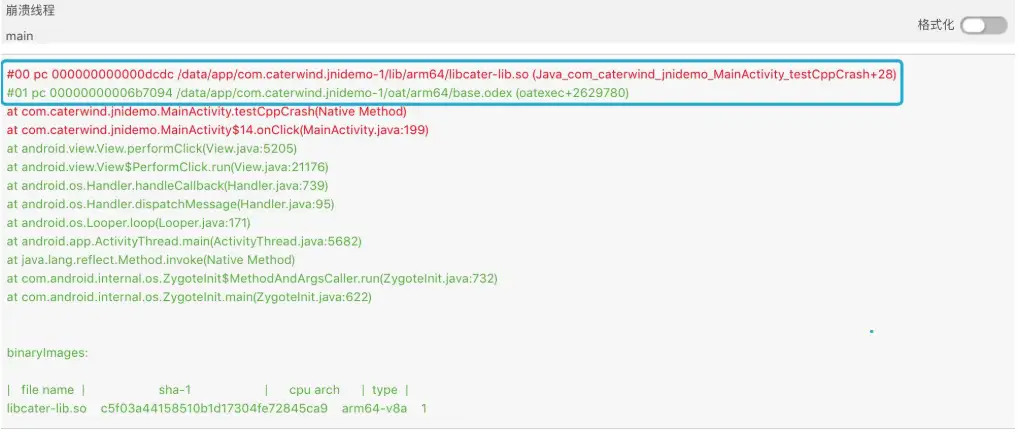
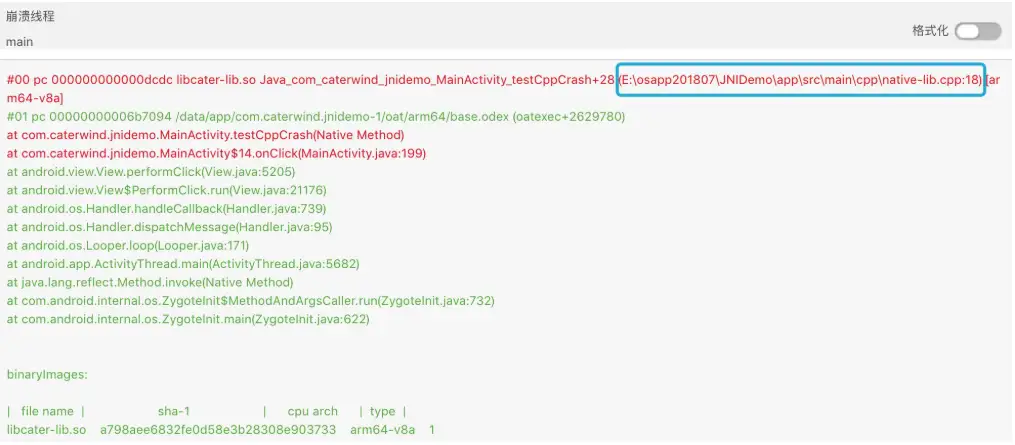
In order to quickly and accurately locate the code location where the application crashes, stutters and errors occur, the Tingyun uses the symbol table file to parse and restore the application crash, stutter and error stack. Click in the upper right corner Symbol table management of the list to upload the symbol table. Automatic symbol table uploading is also supported. An example of the restore effect is as follows:
Original stack:
Post-restore stack:
Explain: Only sysadmin users can upload symbol tables.
For detailed upload instructions, see symbol file management.
List of devices
The device list displays the detailed data of the two types of "OutOfMemoryError" and "Memory Outflow" of the current device.
List display: exception occurrence time, User ID, device ID, App version, device, operating system and operation.
- Out Of MemoryError: An OOM exception was thrown for the Android system.
- Memory overflow: It is an exception to listen to the OOM of the system occupied by the Tingyun SDK according to the memory threshold. If the judgment rule exceeds the threshold for three consecutive statistical periods and the memory ratio of the current period is greater than or equal to "memory ratio of the previous period -0.5", it is judged that an OOM exception has occurred.
You can do the following with the list:
-
Click View details to jump to the OOM details page.
-
The list supports precise query based on exception type, device ID and User ID, and supports fuzzy search.
-
Support for exporting lists to CSV format. Click the Export button at the top right corner of the list to create an export task, which will be displayed in the Export Task List.
Explain: Only 10000 pieces of data can be downloaded.

Crash/Stuck/Exception Details
Crash/stutter/exception details show the details of each exception event occurring in the application, including exception information, exception list, and exception trend chart.
The header of the page displays crash/stutter/exception information, including the number of occurrences, the number of affected devices, and the repair status.
Exception list tab: Show the record of each exception occurrence. Click a record, and the context information of this exception will be displayed below, that is, the end user information, including device startup time, exception time, UserID, device ID, App version, operating system and device model.

Equipment Statistics Tab: Display the change of crash times (bar chart) in each dimension according to the device model, which can view the crash times and the number of affected devices under this dimension, help customers find the device/operating system with the highest crash rate and understand which device crashes occur most frequently, so as to optimize pertinently.
Abnormal Trend Tab: Displays a comparison chart (bar chart) of the number of crashes versus the number of imaging devices, allowing you to see trends in the number of crashes and the impact devices to see how they are changing.
Context information: Displaying the environmental information of the occurrence of the crash event, Including: User ID, application startup time, exception time, session duration, DeviceID, application version, device model, operating system, region, operator, access mode, device memory, memory occupied by application (percentage), remaining memory (percentage), remaining storage space (percentage) and CPU model. CPU instruction set and UI orientation.

Stack information: Show the source of the crash event and the direct cause of the final crash (if the current version does not upload the symbol table file or the symbolization fails, there will be a prompt).

Binary Images: Basic information, specific to iOS apps. This tab is only available for crashes and stutters.

Custom information: You can add 10 pieces of custom information of 100 bytes anywhere after the Tingyun SDK is started. For example, you can add the account and contact information of a real user.
Adding method: NBSAppAgent. SetUserCrashMessage (String key, String value);
System log: For Android SDK, users can customize the system log. After defining, Crash details a System log new tab will be added to the page.

There are Carton details: more stutter details than crash details, such as flame map, request waterfall map, ANR Message and Stack.
Flame chart: For the stutter event, the main thread is continuously sliced during the stutter to collect the information of N call stacks (collected every 100ms by default) during the stutter process, and the flame diagram is used for summary display and comprehensive analysis to automatically find out the user code with the highest probability of occurrence, so as to directly locate the root cause of the user stutter.
Explain: Support the collection of the main thread call stack according to a certain frequency. By default, the main thread call stack is collected every 100ms. In addition to the main thread call stack, CPU utilization and memory usage are also collected.
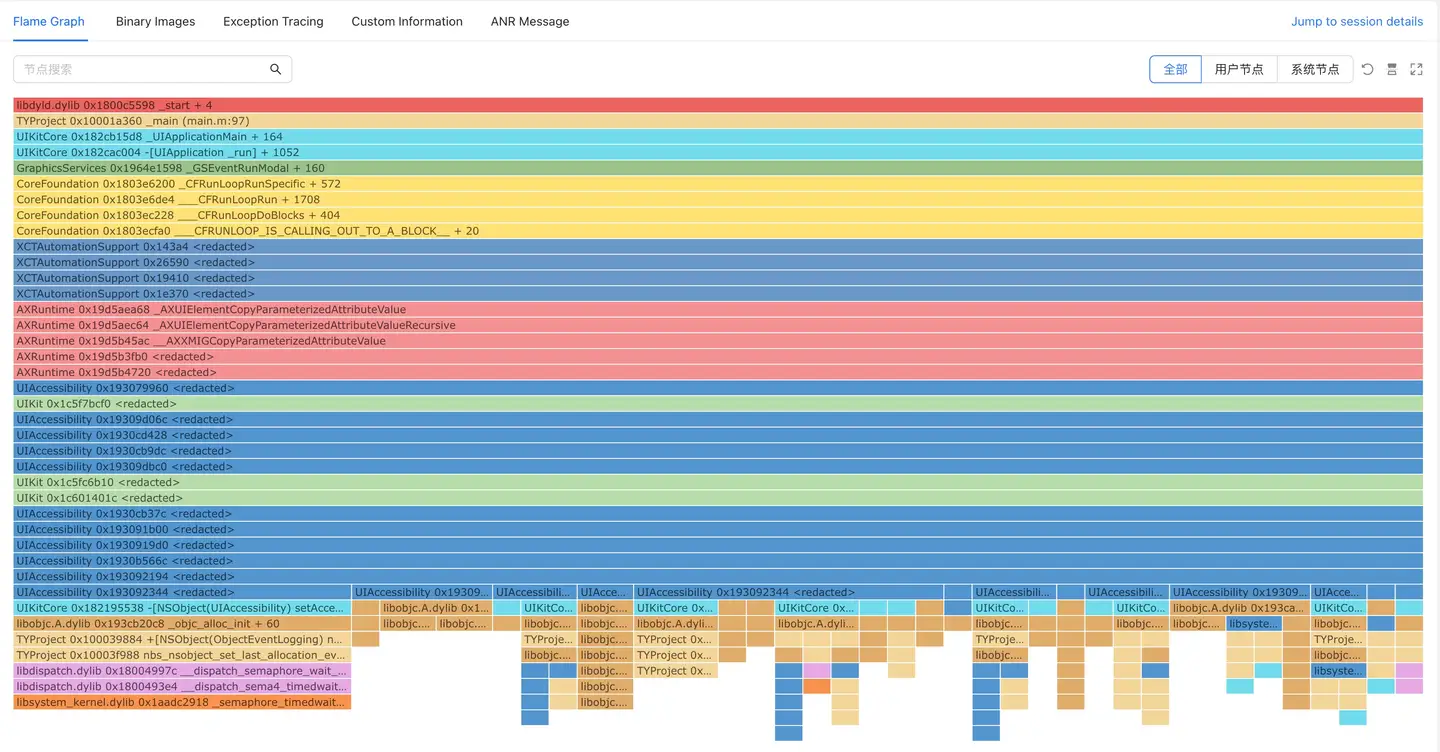
Each column of the flame diagram represents a call stack, and each cell represents a function. The detailed description is as follows:
-
The vertical axis represents: The vertical axis represents the depth of the call stack, which is used to represent the call relationship between functions: the following function is the parent function of the above function. Arranged from top to bottom according to the calling relationship, the top grid represents the sampling time. The longer the grid, the longer it takes to apply the stutter.
-
The horizontal axis indicates that the flame graph will collect multiple call stack information and sort them horizontally according to the loading time sequence.
The width of the horizontal axis grid represents the frequency of its occurrence in the sampling (the default interval is 100ms to collect data, so the higher the frequency of occurrence, the longer the occupancy time), so the larger the width of the grid, the greater the possibility that it is the root cause of stuttering.
-
Flame grid color: randomly generated in the background.
-
Prompt box display (when the mouse hovers over any flame diagram):
-
Name: displays the complete name of the currently selected call stack (line can be automatically wrapped).
-
Time consumption: displays the specific time consumption of the currently selected call stack, which is the number of calls * sampling frequency.
-
Times: displays the number of times the currently selected call stack appears.
-
Proportion: displays the proportion of the currently selected call stack on the parent level.
Explain: Proportion = number of child calls/number of parent calls
-
-
Node search is supported, and the corresponding call stack is highlighted after the search is selected.
-
Node filtering is supported. By default, all user nodes and system nodes will be highlighted. Click Cancel to cancel the display.
-
The flame chart can be reversed from top to bottom or from bottom to top.
-
Support to maximize the display of the current flame map content.
Anomaly traceability: Provide the backtracking function to record the user actions through the stutter track, so as to truly reflect a series of user behaviors before the occurrence of the current exception, and finally restore the scene when the current exception occurs.

Request a waterfall chart: Shows the progress of each request in the form of a waterfall chart, as well as the time of the exception.

ANR Message: Details of ANR.
Stack: All thread stacks when ANR occurs.
OOM details
OOM details is the detailed information of the OOM exception event on the current device. The details page distinguishes between Android and iOS operating systems.
Explain: OOM only supports Java and OC codes, including Android, iOS, and HarmonyOS 3.0. Currently, Android does not support non-Java Hybrid applications.
Android system
Environmental Information User ID, application startup time, exception time, session duration, DeviceID, application version, device model, operating system, region, operator, access mode, device memory, memory occupied by application (percentage), remaining memory (percentage), remaining storage space (percentage) and CPU model. CPU instruction set and UI orientation.

Holding object (root cause analysis): First, check the Retained Heap. If the Retained Heap is very large and its Shallow Heap is relatively small, it indicates that the held objects have not been released in time. At this time, you need to find out which large objects in the response class have not released the memory, causing the GC to be unable to reclaim the memory.
- Object: The format is "Object Class Name + Memory Address" or "Object Array + Memory Address".
- Ref. Objects: The number of objects held. Only nodes with Shallow Heap larger than 256KB are displayed.
- Shallow Heap: The amount of memory occupied by the object itself.
- Retained Heap: The sum of all objects that can be removed from memory by the GC after they have been reclaimed by the garbage collector. Retained Heap is a more accurate representation of how much memory an object actually occupies.
- The page supports jumping to Session details.
Memory details: Provide detailed memory data related to Android devices, including foreground memory and background memory: physical memory, Java used memory, video memory, virtual memory, Java memory usage, Java physical memory usage, Native physical memory usage.
IOS system
Environmental Information: User ID, application startup time, exception time, session duration, DeviceID, application version, device model, operating system, region, operator, access mode, device memory, memory occupied by application (percentage), remaining memory (percentage), remaining storage space (percentage) and remaining battery capacity. CPU instruction set, CPU usage, and jailbreak.

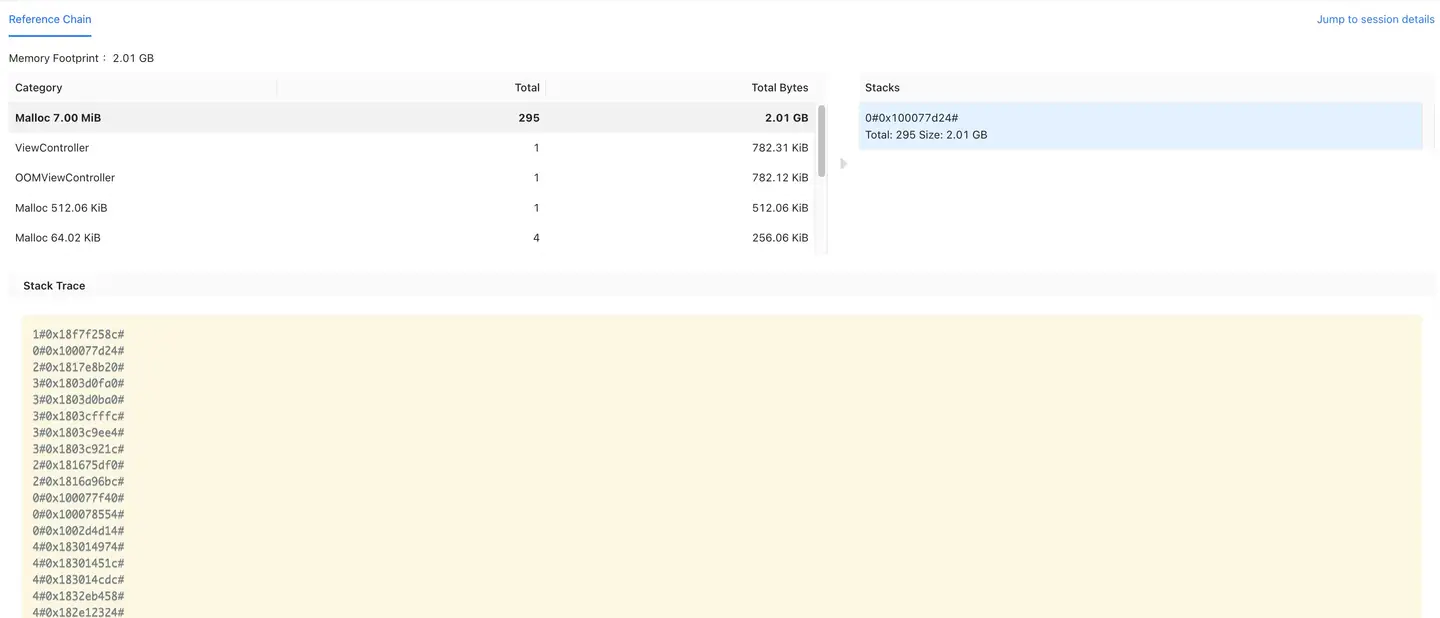
Reference chain (root cause analysis) First, find the most likely category in the reference chain from both the number of objects and the size of the object's memory allocation. Second, select a caller in Stacks and backtrack to its parent node to check the reference relationship and find a possible reference path (Total and Size can be used to determine the number of occurrences and size of the currently selected Stacks). Finally, check the call stack information during memory allocation in Stacks Trace, and then determine which business module has the problem.
- Category: Memory allocation category (possibly the size of the memory allocated for a specific object name or Malloc).
- Total: Number of category calls.
- Total Bytes: Total size of category memory allocation.
- Stacks: The caller (may be one or more).
- Stacks Trace: Call stack information during memory allocation.
- The page supports jumping to Session details.
Anomaly details sharing
Click the button in the upper right corner of the details page to generate a sharing link for the details of "crash", "stutter" or "custom error". You can provide the link to a third party for data analysis, viewing and other work. The link can view the corresponding content without login and is permanent.