CDN analysis
The App SDK will automatically identify CDN vendor information through CNAME, and provide analysis and statistical charts for CDN data. All chart data sources are identified CDN request data.
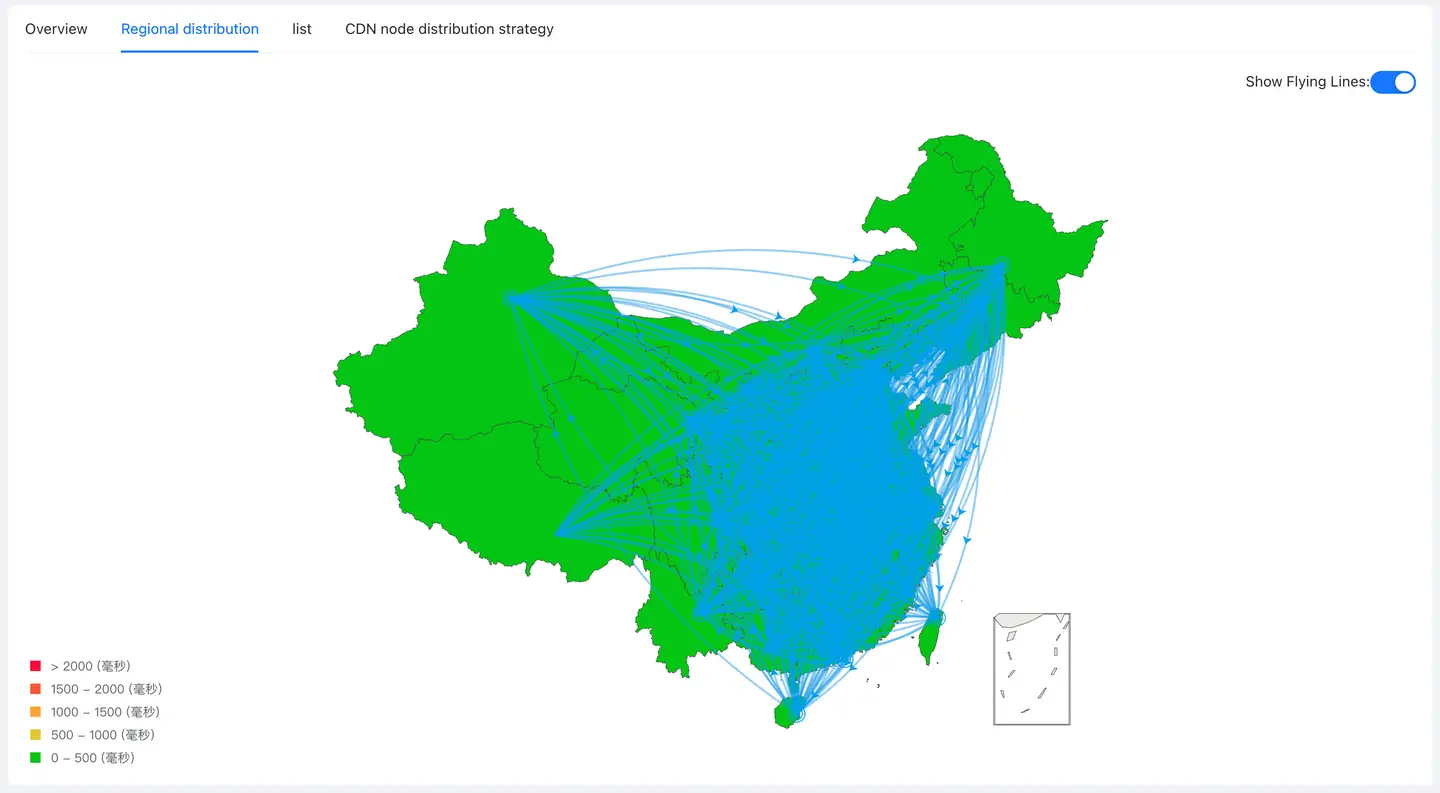
Map It mainly provides the global distribution of the response time of each CDN request. Currently, it only supports the display of the CDN flying chart in the "China" region, and highlights the region where the CDN node is located, which can clearly display the invocation of CDN nodes in each province.
If there are too many flying lines, you can hide the flying lines by turning off the switch in the upper right corner
List It mainly analyzes the problems of cross-regional access and cross-operator access of CDN nodes, and provides the pie charts of "same region and different regions" and "same operator and different operators", as well as the corresponding node list. The list supports user-defined header, and the indicator to be displayed can be selected through Customize the header the drop-down menu. Click the icon in the upper right corner to download the current list data to the local in Excel form. At most 10000 pieces of data can be downloaded.

CDN quality assessment displays the change trend chart of "CDN network time", "CDN availability" and "CDN transmission rate" to comprehensively evaluate the quality of CDN vendors.
Explain: The CDN vendor data shown in the description of this document are all internal test simulation data, which are only used for chart description and data display. The test data cannot reflect the actual performance of each CDN vendor.

List of hosts Display the performance data when the user's host accesses the CDN node, including host address, accessed CDN vendor, throughput rate (rpm, requests per minute), network time, availability, HTTP error rate, network error rate, transmission data volume, network delay and packet loss rate.
Click the host IP address. The list only displays the performance data of the CDN vendor accessed by the host. At the same time, the current IP address is automatically added to the filter criteria. The network delay graph and packet loss rate graph below will also show the statistics of the current host.

SDK detects the current network environment by means of passive dial test, and obtains the network delay and packet loss rate to judge whether the network environment is stable under the selected conditions. When the network delay suddenly increases or the packet loss rate suddenly increases, it can be determined that the increase in network errors (errors such as unknown host or connection timeout) is caused by the deterioration of the network environment.
The top right corner of the graph also shows the average network latency and packet loss rate over the statistical period.

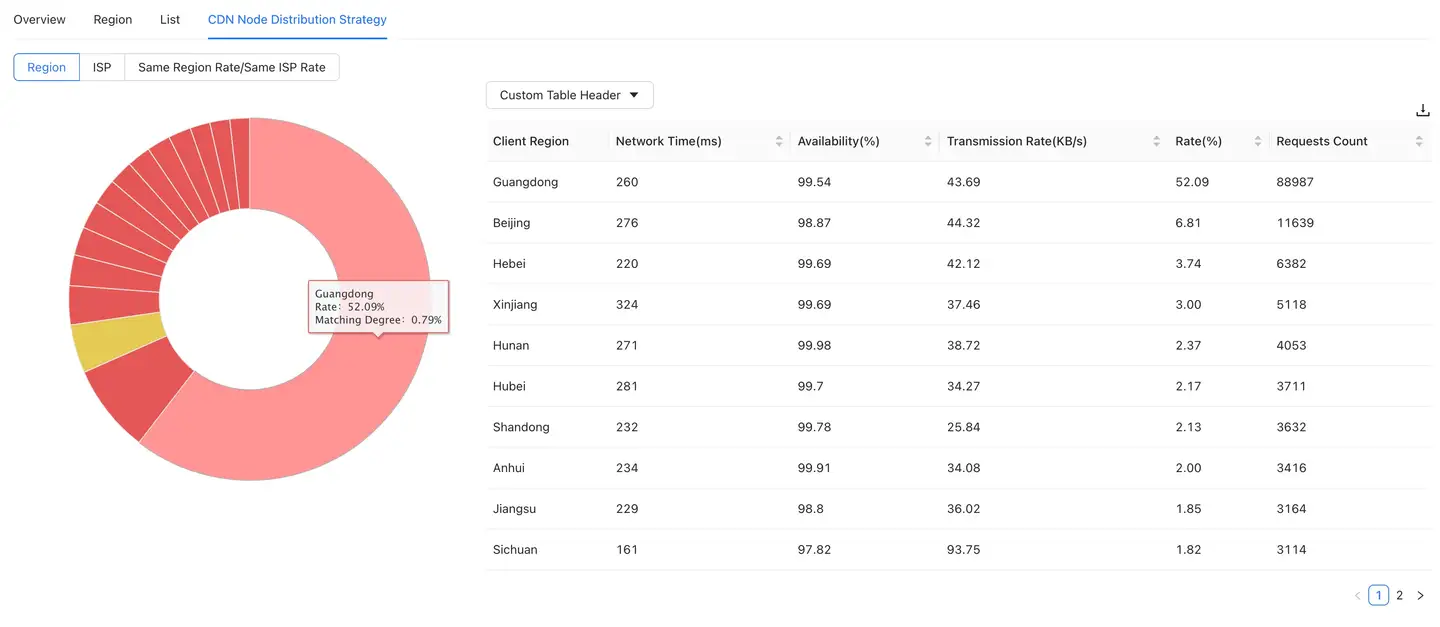
CDN node distribution strategy It is to analyze the performance data of users in a certain region or users of a certain operator when accessing CDN nodes to help you understand the access quality of CDN. It is composed of "Rising Sun Map" and "CDN Node List", and supports regional and operator dimension switching.
Rising Sun Map:
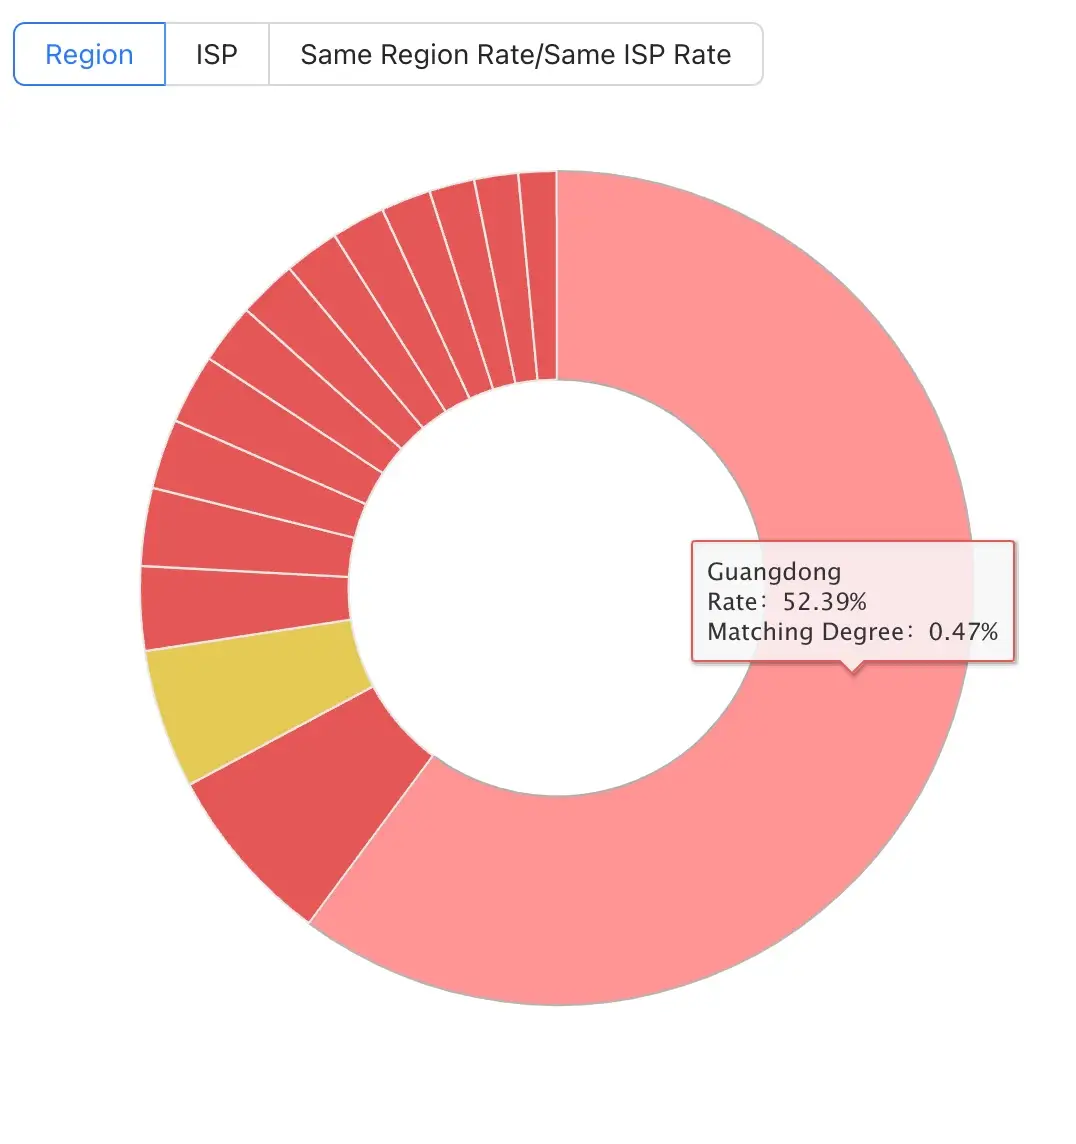
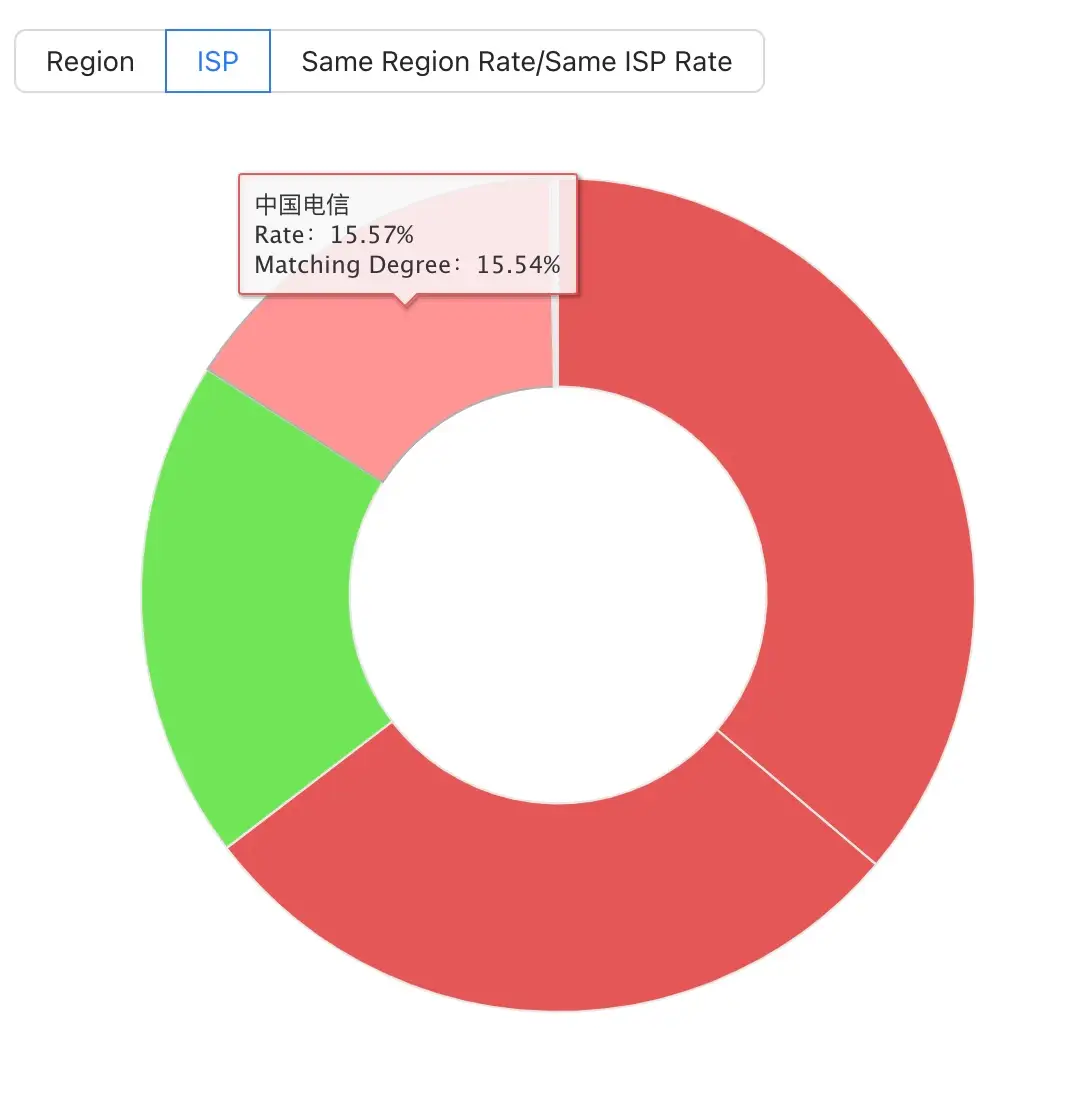
When the region dimension is selected, click on a part of the rising sun chart, the outer ring will display the second layer, and the selected region will be focused on the center of the circle. The second layer displays the client access distribution of each operator in the selected region. At this time, the right side will also display the data of the client access CDN of each operator in the selected region.
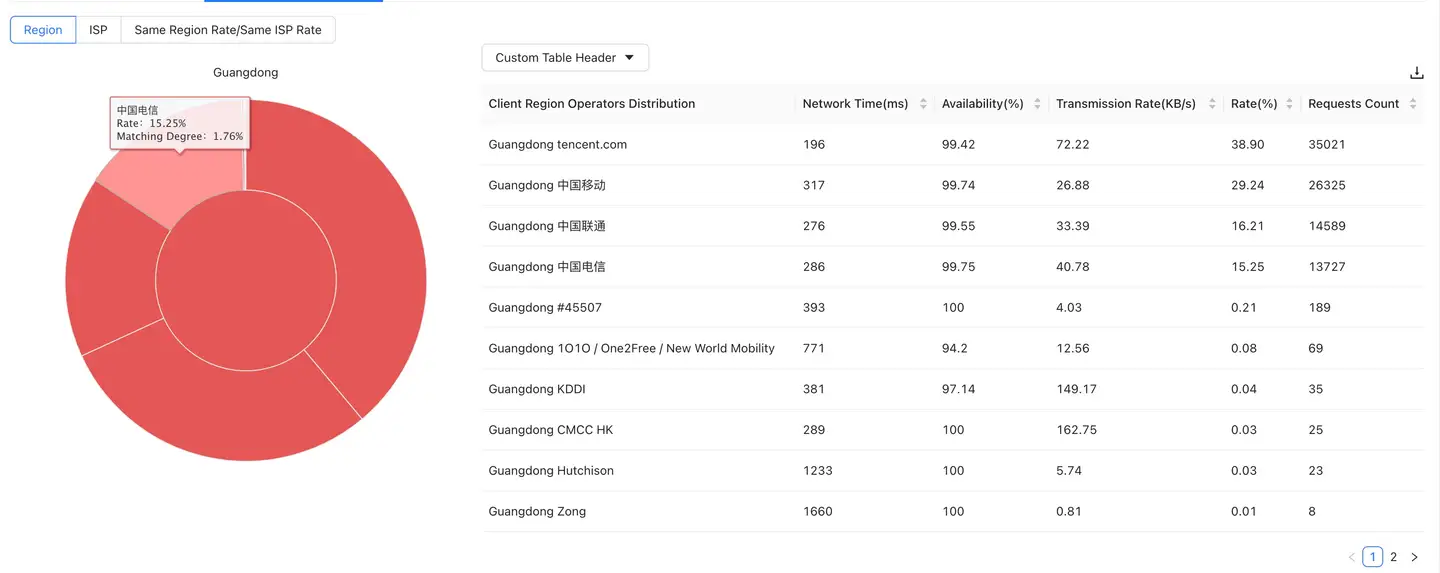
Continue to click a part of the second layer of the rising sun chart. The outer ring will display the distribution of the proportion of each CDN node accessed by each operator in each region. The center part displays the data of the selected region and operator. At this time, the right side will correspondingly display the performance data of each CDN node accessed by each operator in each region.
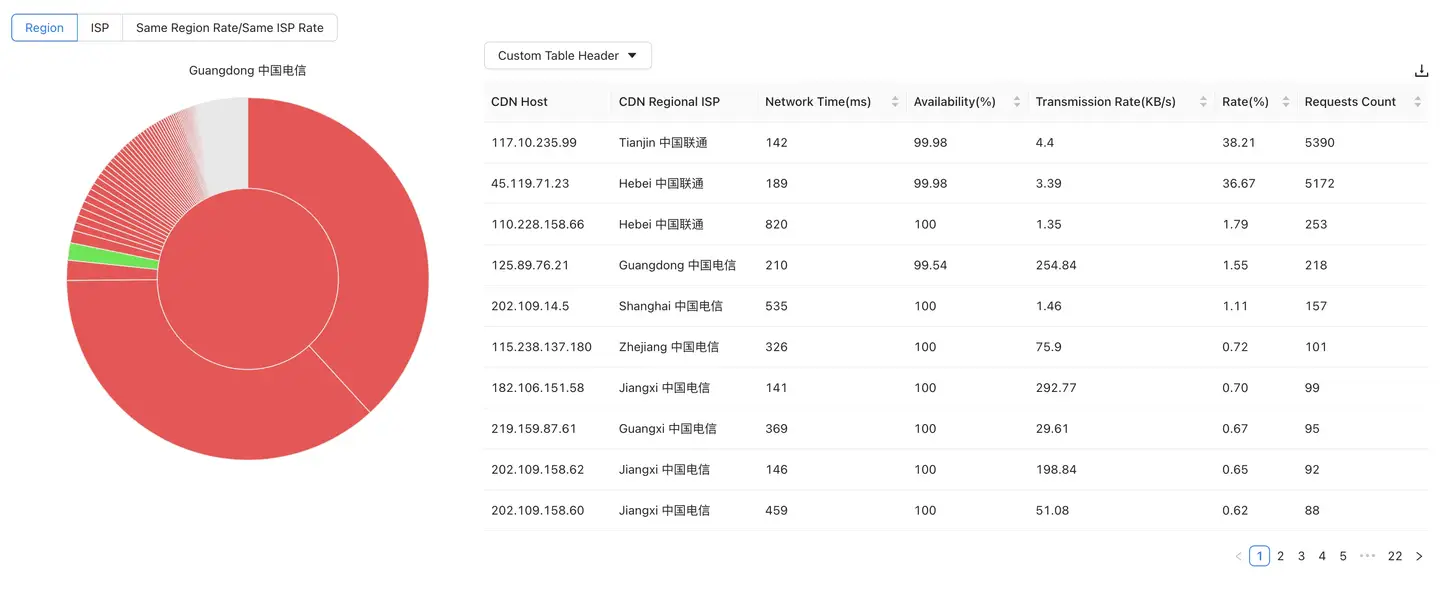
Clicking the center of the circle displays the third layer. The third layer actually shows the distribution of the proportion of each CDN node accessed by each operator in the above regions.
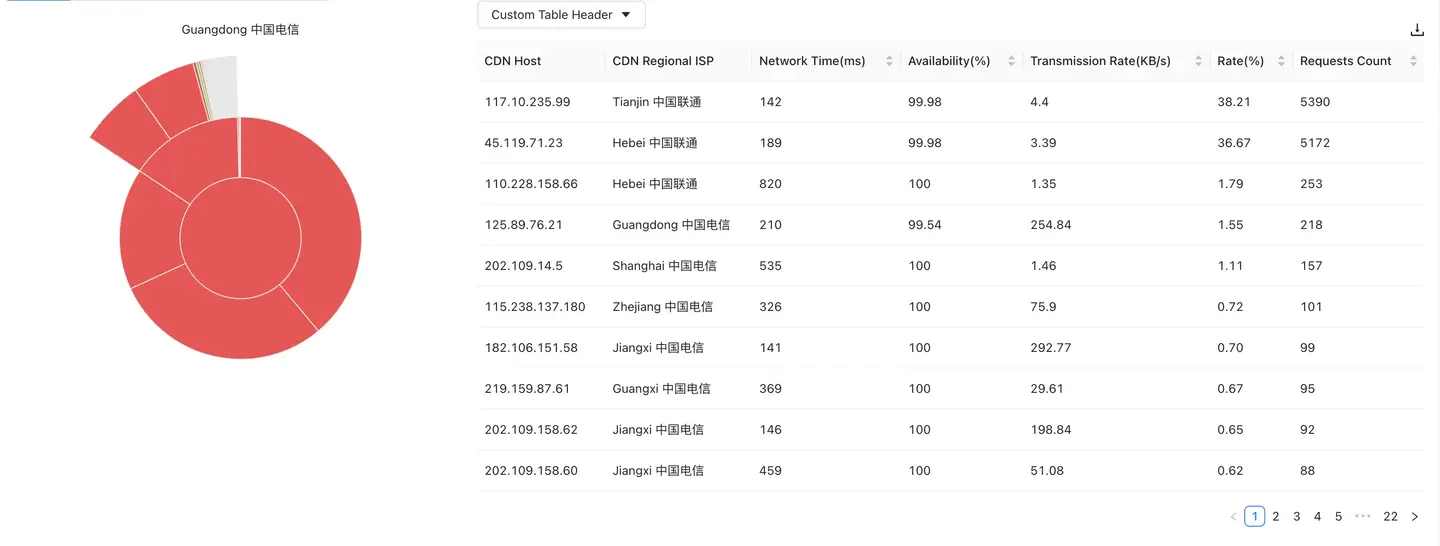
When switching to the operator dimension, the display mode is similar. Please refer to the following table for details:
| Floor count | Regional perspective | Operator perspective |
|---|---|---|
| The first floor | Region | Operator |
| The second floor | Region + operator | Selected geographic distribution under the operator |
| The third floor | Distribution of CDN nodes under the selected region and operator | Selected CDN node distribution under the operator and geographic region |
Proportion: the percentage of the number of requests under the current dimension in the total number of requests.
Matching degree: whether the client dimension data is the same as the CDN node dimension data.
| Dimension | Explain | Calculation formula |
|---|---|---|
| Region | Compare whether the selected region matches the region where the CDN node is located | Number of requests from the same region / Total number of requests |
| Operator | Compare whether the information of the operator in the selected region is matched with that of the CDN node operator | Number of requests from the same operator / Total number of requests |
CDN node list: The content displayed in the list is dynamically refreshed with the rising sun chart on the left. The list supports user-defined header, and the indicator to be displayed can be selected through Customize the header the drop-down menu. Click the icon in the upper right corner to download the current list data to the local in Excel form. At most 10000 pieces of data can be downloaded.
