Protocol extension
Protocol extension is a network protocol extension analysis module provided by Tingyun App for R & D, operation and maintenance personnel, which is mainly used for data collection and analysis of network protocols other than HTTP/HTTPS.
Two scenarios are supported:
-
Predefined scenario: WebSocket and gRPC network data collection are supported by default.
-
Custom scenario: The user can upload the data to be collected to the report platform of Tingyun with the help of the API interface corresponding to data collection, and provide data display and corresponding dimension analysis.
Explain: This function is only supported by SDK version 2.16.0 and above.
Data summary
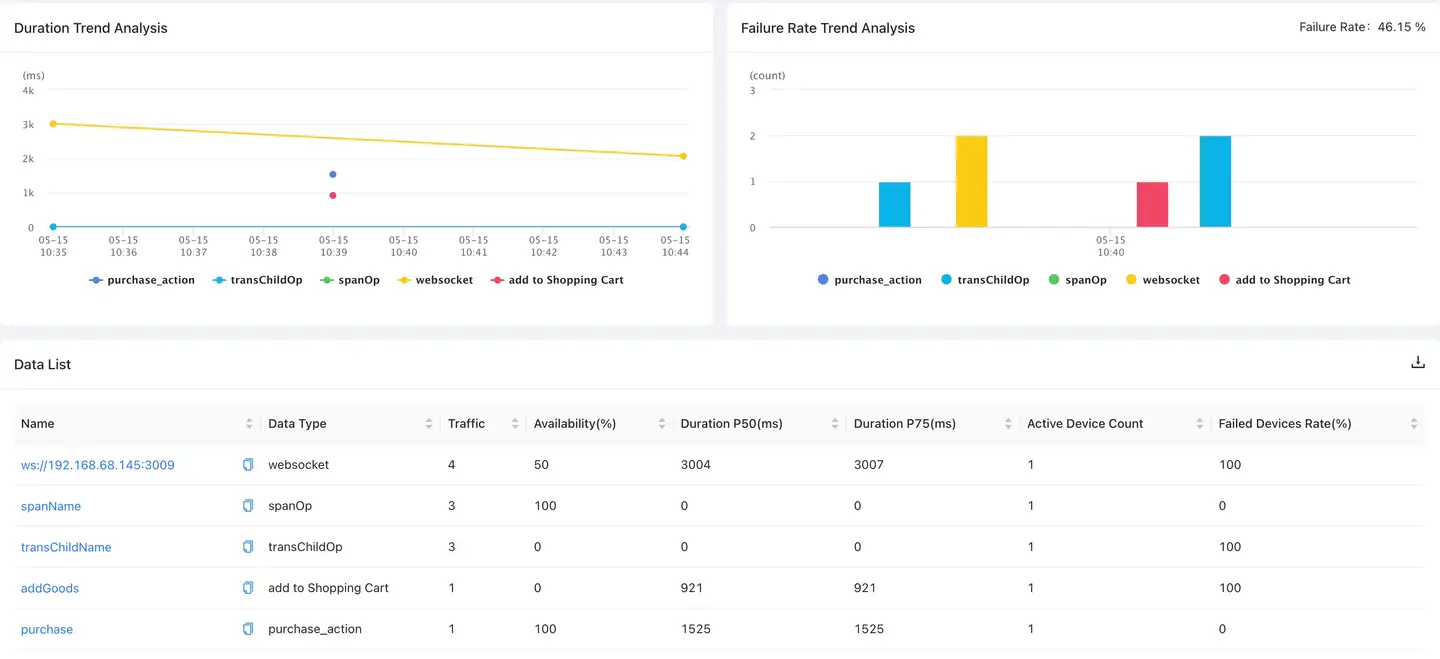
Select User experience>Mobile App>Network Analysis>Protocol Extension one by one in the navigation bar to enter Protocol extension the page, which comprehensively displays the "Time Consumption Trend" chart, "Failure Rate" trend chart and data list of the collected data. The data list shows in detail the data uploaded by "Predefined Scenario" and "Custom Scenario". For the specific uploading method and interface call, please refer to API description the Protocol extension section in.
Global filtering
The data in the protocol extension page supports global filtering. Click Add a filter the button in the upper Filter conditions area of the page to filter the general dimensions, including name, data type, device, operating system, region, operator and access mode.
Detailed analysis
Click in Name the data list to jump to the data details page, which includes two parts: indicator analysis and exception details list.
Indicator analysis
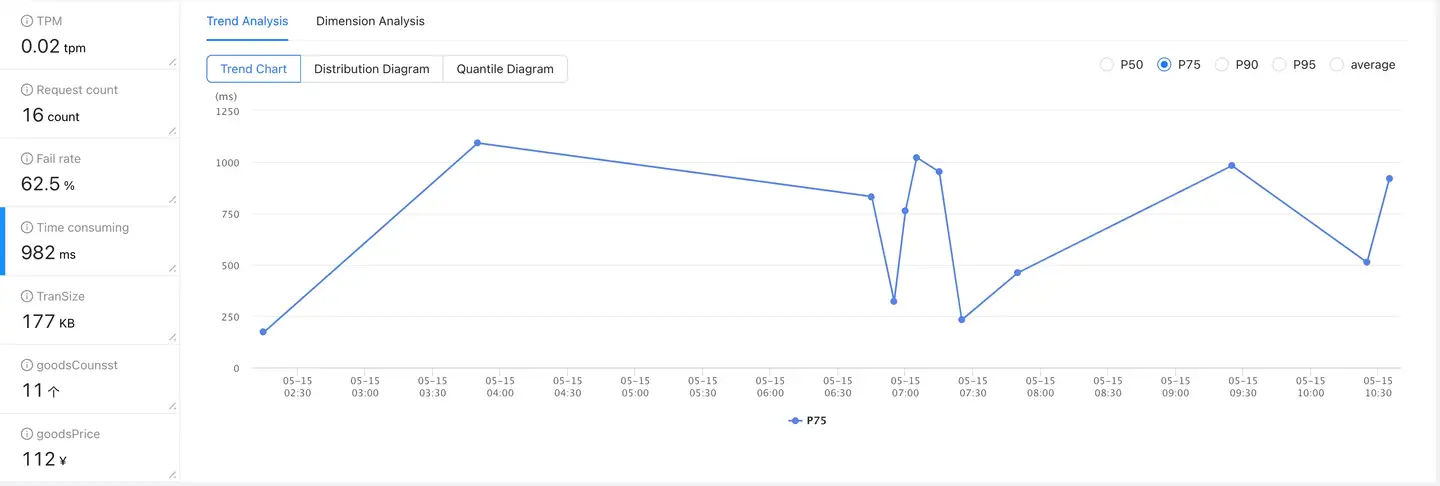
Through the data details page, you can perform "trend analysis" and "dimension analysis" on the indicator data. The detailed data supports "global filtering". In addition to the general dimension, the filtering conditions can also display the user-defined (TAG) dimension uploaded through the protocol extension API interface for filtering.
The indicator bar is displayed on the left side of the page. You can view basic indicators and user-defined indicators.
-
Basic indicator: indicator collected and calculated by SDK by default.
- TPM: Visits per minute.
- Visits: The total number of accesses for this data type.
- Time consumption: the time consumption statistics of this data type, which displays the 75th percentile by default.
- Failure rate: the number of errors/visits. Take WebSocket as an example. When "status = -1", it is considered that an error occurs, which can be customized through the interface.
-
User-defined indicators: User-defined indicators need to be uploaded through the interface. For details, please refer to API description the Protocol extension section in.
Analysis charts are displayed on the right side of the page, including the Trend Analysis and Dimension Analysis tabs.
-
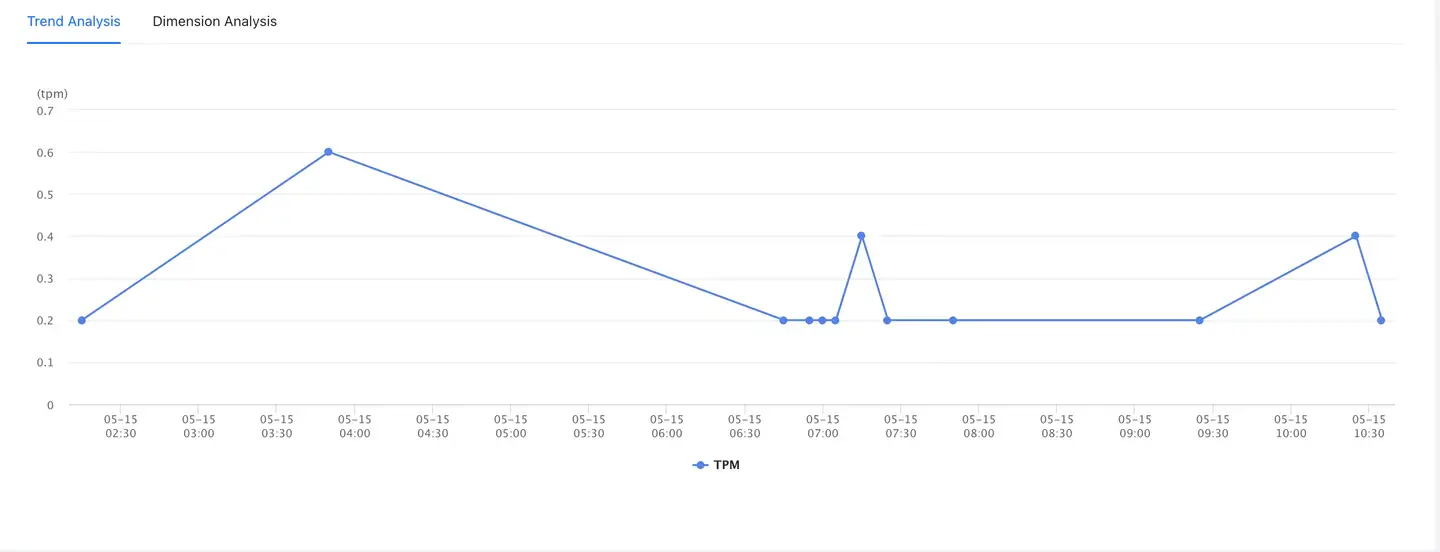
Trend analysis: The user can view the trend change of the current indicator through the trend analysis chart, and global filtering is supported. Indicators can be toggled on the left.
-
For TPM, access volume and failure rate, only the trend chart of time variation is supported to be analyzed.
-
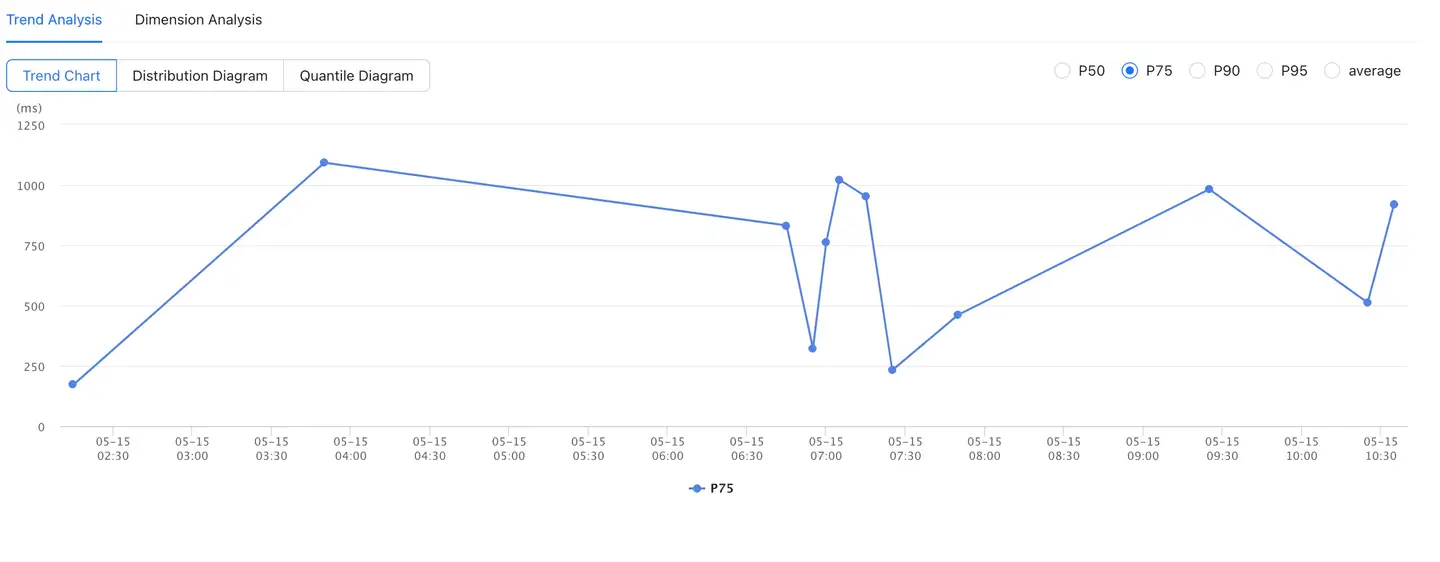
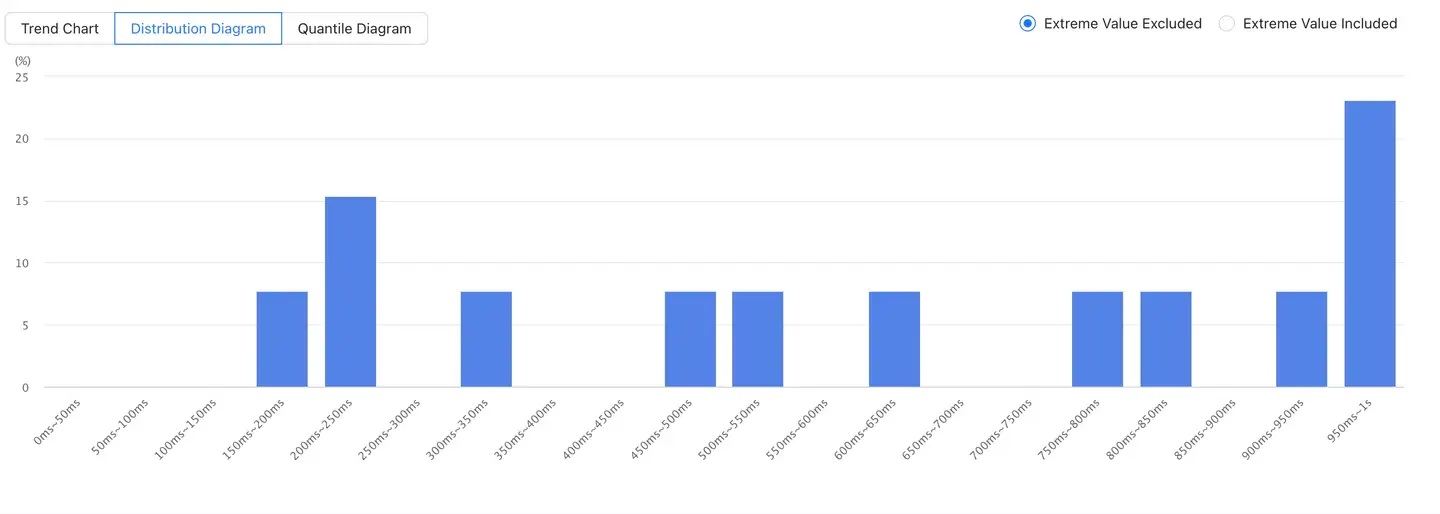
For time consuming and custom indicators, in addition to trend charts, distribution charts and quantile charts are also supported.
Trend chart: display the 75th percentile value by default, and you can select other percentile values and mean values as required.
Distribution chart: by default, the data of extreme values (greater than the 75th percentile) are removed, and the bucket data of 0 ~ 75th percentile values are displayed. When selected Contains extreme values, the bucket data of 0 ~ 100th percentile values are displayed.
Quantile chart: shows the trend of the current indicator from the 5th quantile to the 100th quantile.
-
-
Dimension analysis: dimension analysis can be used to view the sample distribution of the current indicator in different dimensions, such as application version, equipment, operating system, etc. The number of data to be displayed can be configured in the upper right corner, and at least 5 data can be displayed. Click
to download detailed data for dimensional analysis.
- Support the display of histograms and bar charts for TPM, visits, and failure rates.
- Support the display of color block chart, column chart and bar chart for time-consuming and user-defined indicators.
List of details
The details list only displays all the detailed data. Click Operation the View details column to learn all the contents of the data. Click in the upper right corner to download detailed data for all exceptions. Click the button in the upper right corner Customize the header to check the dimensions to be displayed in the table.

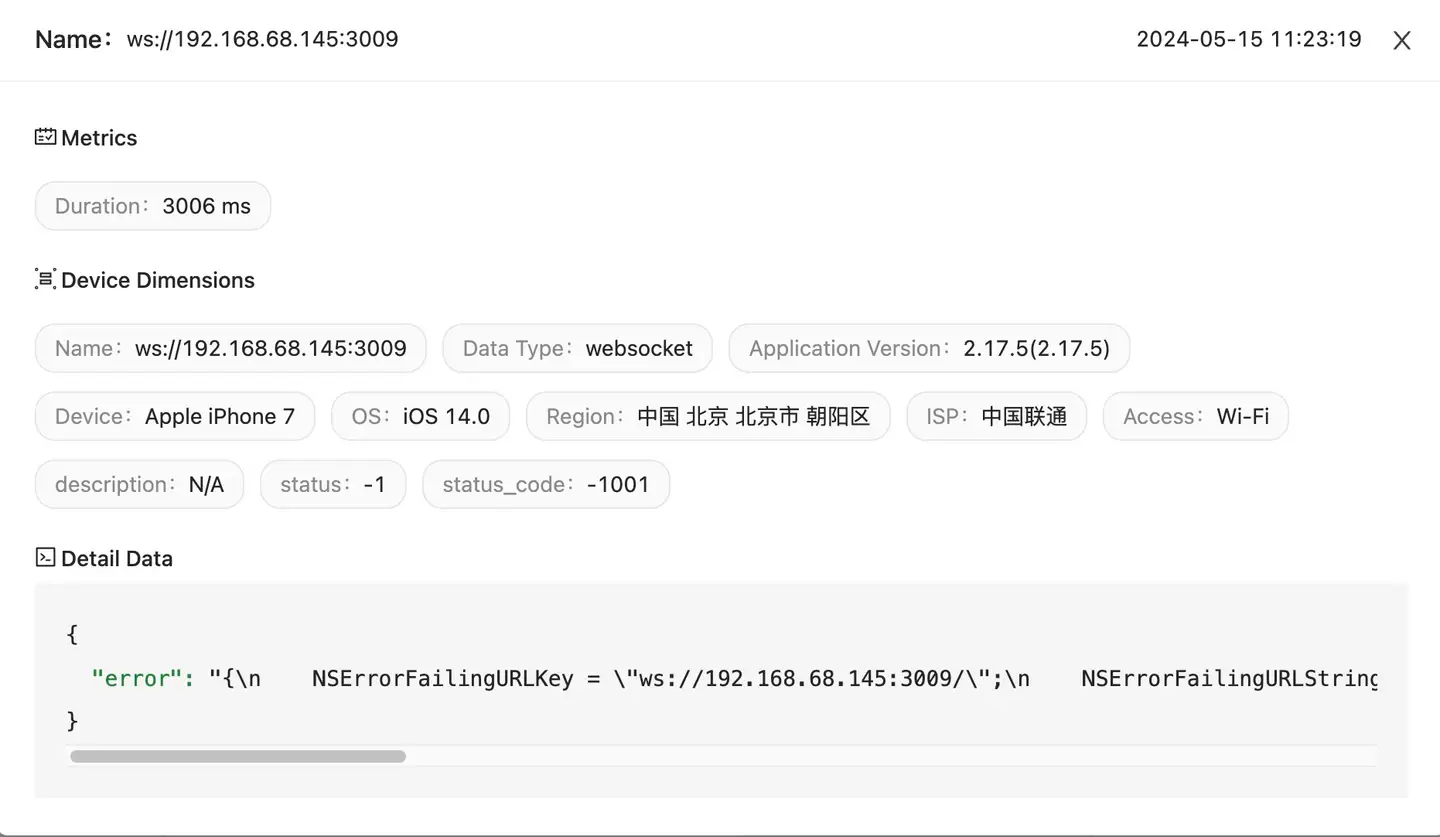
-
Indicator: displays all statistical indicators under this data type, including time consumption indicators and user-defined indicators (indicators uploaded through metrics).
-
Equipment Dimension: displays all dimensions under this data type, including default dimension and user-defined dimension (dimension uploaded through tag).
-
Detailed data: display the detailed data under this data type (WebSocket will display the error details for the data uploaded through Data).