Request analysis
The network request analysis adopts the method of [Passive Dial Test] to detect the [Network Delay] and [Packet Loss Rate] under the current network environment of the client through the Ping command, which provides key data support for the operation and maintenance personnel to locate whether the network error (unknown host or connection timeout error) is due to the "client network environment" problem.
Filter the data
At the top of the Filter conditions page, the user clicks Add a filter, The analysis data in the page can be filtered according to the application version, device, operating system, channel, region, operator, access mode, domain name, server IP, CDN vendor, request type, protocol type, request error, packet size, key request and request grouping.
Overall trend analysis
The upper left corner of the page shows the request response time, throughput rate, and request error rate of the current application.
The Trend analysis chart on the right shows the trend of each statistical indicator, the number of successful requests and other data. Users can select statistical indicators from the drop-down menu in the upper right corner. Including: request response time, request error rate, client time, DNS time, SSL time, TCP time, first packet time, remaining packet time, average transmission data volume, TCP times, multiplexing rate, throughput rate, transmission rate, HTTP error rate, network error rate and network delay and packet loss rate. Click the download icon in the upper right corner to export the statistical data of the trend chart to CSV format.

Multidimensional analysis
After a statistical indicator is selected in the trend chart above, multi-dimensional analysis can be performed through the Domain name analysis, Host analysis, Regional analysis and IPv4/IPv6 tabs below. The data of trend analysis, multi-dimensional analysis list and trend chart of indicators are linked.
Click the icon in the upper right corner to download the data in each list or chart to the local computer in Excel form. At most 10000 pieces of data can be downloaded.
Domain name analysis
Count requests Domain name analysis based on domain names, including two forms of analysis: list and trend chart.
The list displays the request address, throughput rate, request response time, number of requests, number of slow requests, request error rate, number of HTTP errors, and number of network errors. The throughput rate is sorted from high to low by default. Click the drop-down menu at the top left of the chart to select the data type displayed according to "Host", "Host + URI" and "URI". Click Request Address on the left to add the selected address to the filter criteria and view the analysis chart of the request address.

The trend chart below shows the change trend of the corresponding indicator of each request address.

Host analysis
Statistics of requested metric data Host analysis based on the host IP address, including two forms of analysis: list and trend chart.
The list displays the host name, throughput rate, request response time, number of requests, number of slow requests, request error rate, HTTP error times, network error times, network delay, packet loss rate and availability. By default, the throughput rate is sorted from high to low. Click Host on the left to add the selected host to the filter criteria and view an analysis chart of requests to that host.

The trend chart below shows the change trend of the corresponding indicators of each host.

Regional analysis
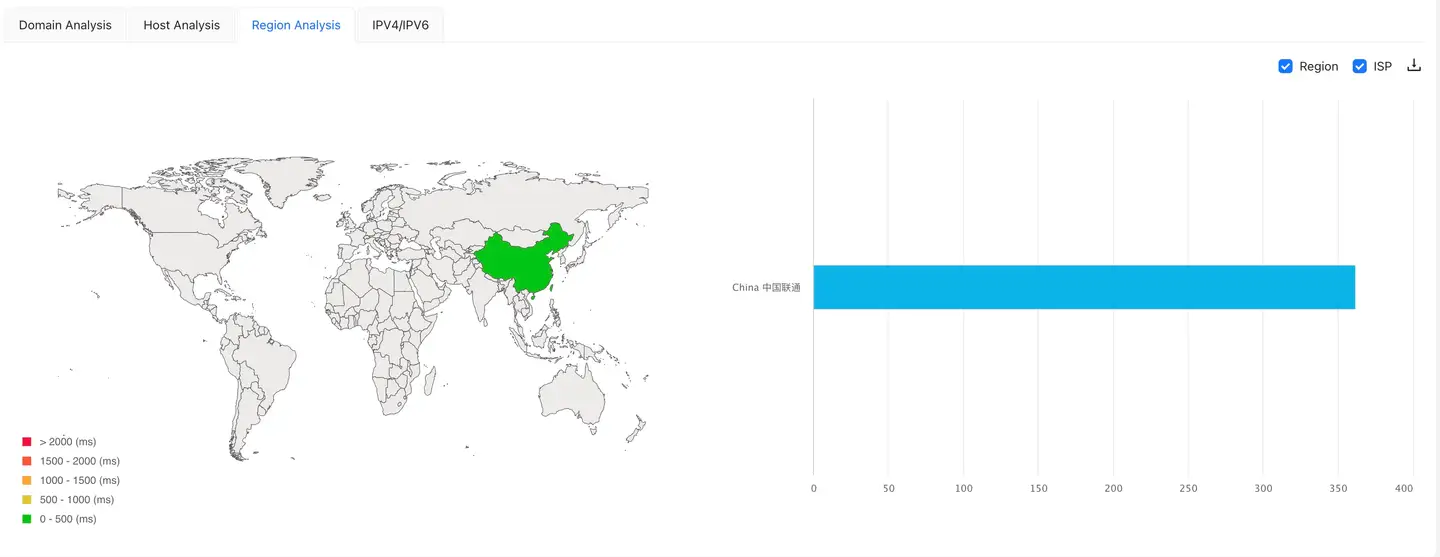
Display the performance data distribution of each country or region in the form of Regional analysis map and horizontal bar chart, and provide the combined analysis of "region" and "operator" to view the performance of different indicators in each region and operator. In the map, different time intervals will show different colors. The bar chart on the right shows the top 15 regions with the highest throughput by default.
The world map is displayed by default. Click a specific country to enter the map of that country. Similarly, it can be positioned at the provincial level (including municipalities directly under the Central Government), prefecture-level cities and district and county levels. Mouse over an area to display detailed statistics. The bar chart on the right will also be displayed accordingly with the change of the map.

IPv4/IPv6 Analysis
IPv4/IPv6 Display the request indicator data of IPv4 host and IPv6 host, including two analysis forms of list and trend chart.
The list displays the host, throughput rate, request response time, number of requests, number of slow requests, request error rate, HTTP error times, network error times, network delay, packet loss rate and availability. The throughput rate is sorted from high to low by default. Click IPv4 or IPv6 on the left to add the selected host type to the filter criteria and view the analysis chart of requests accessing this type of address.

The trend chart below shows the change trend of the corresponding indicators of IPv4 and IPv6 hosts.
Detailed analysis
Slow request analysis
Click the "Number of slow requests" data in the above list to enter the slow request analysis page. Click the button in the upper Return left corner to go back to the previous page.
-
Slow Request List: displays the slow request statistics of the selected request address by default. You can set up global filtering to view slow request data for single or multiple URLs.

-
Slow request performance: After the request entry is selected in the slow request list, the performance indicator change trend chart of the slow request will be displayed below. You can select statistical indicators from the drop-down menu in the upper right corner, including request response time, client time, network time, DNS time, SSL time, TCP time, first packet time and remaining packet time. The upper right corner of the graph also shows the average of the slow request response time over the entire statistical period.
-
Chart of network delay and packet loss rate: SDK detects the current network environment through passive dial test to obtain the network delay and packet loss rate, so as to judge whether the network environment is stable under the selected conditions. When the network delay suddenly increases or the packet loss rate suddenly increases, it can be determined that the increase in network errors (errors such as unknown host or connection timeout) is caused by the deterioration of the network environment. The top right corner of the graph also shows the average network latency and packet loss rate over the statistical period.

-
Top 10 Region Operator Analysis: The top 10 regions in terms of request response time are displayed by default. Check the check box in the upper right corner of the chart to view the performance data sorting of indicators under the combination of regions, operators and access modes by any combination of regions, operators and access modes. You can switch the statistical indicators in the drop-down menu in the upper left corner, including request response time, client time, network time, DNS time, SSL time, TCP time, first packet time and remaining packet time.
-
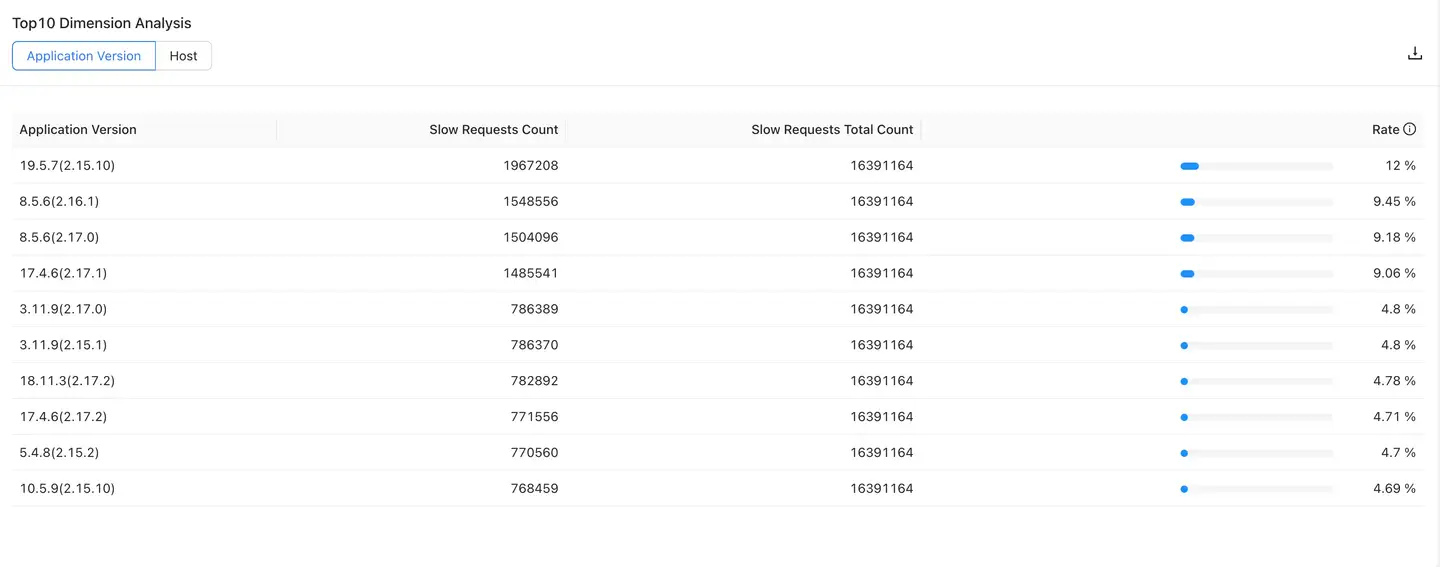
Top 10 dimension analysis: The top 10 application versions with slow request times are displayed by default. Click Host the tab to view the top 10 hosts for slow requests.

-
Slow Request Detail List: Shows performance data related to slow requests accessing the selected request address. Including request occurrence time, request address, response time, client time, DNS time, TCP time, SSL time, first packet time, remaining packet time, network delay, packet loss rate, Local DNS, client IP, server IP, number of uploaded bytes, number of downloaded bytes, App version, regional city, operator, access mode, UserId, TraceID, and parameters.

HTTP Error/Network Error Analysis
Click the "HTTP Error" and "Network Error" data in the above list to enter the error analysis page. Click the button in the upper Return left corner to go back to the previous page.
-
Error Trend Chart: displays the error statistics of the selected request address by default. You can set up global filtering to view trends and pie charts for HTTP errors or network errors.

-
Top 10 Region Operator Analysis: The top 10 regions in terms of the number of error requests are displayed by default. Check the check box in the upper right corner of the chart to view the number of errors sorted by region, operator, and access mode.
-
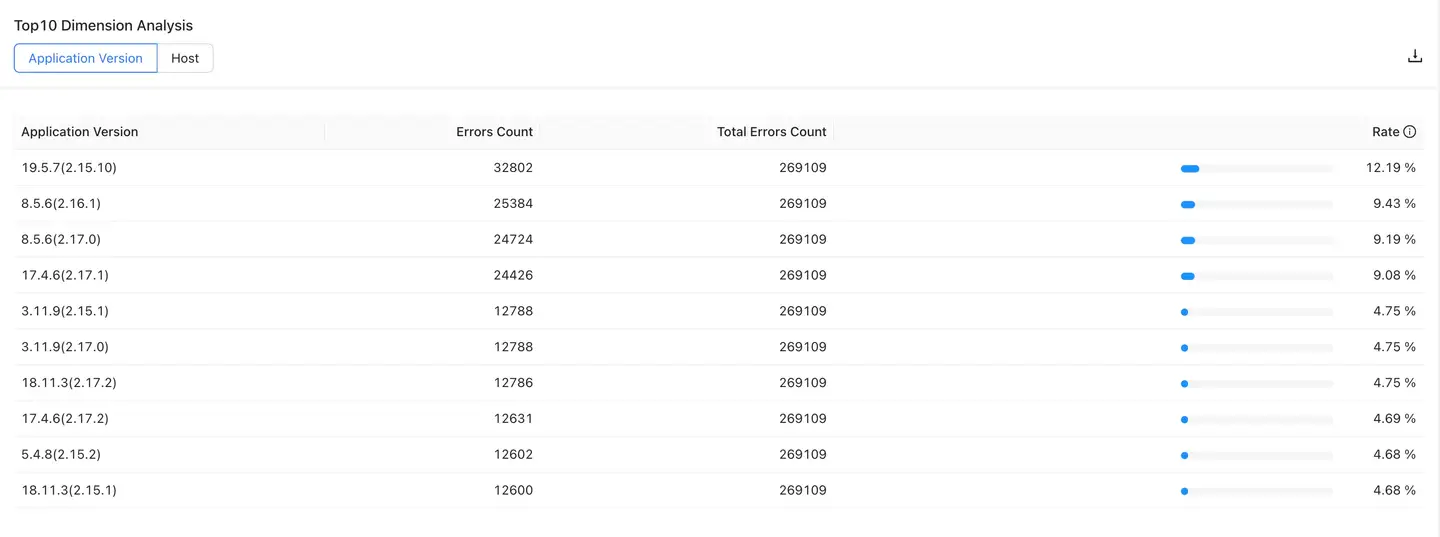
Top 10 dimension analysis: The top 10 application versions with the number of errors are displayed by default. Click Host the tab to view the top 10 hosts in terms of the number of errors.

-
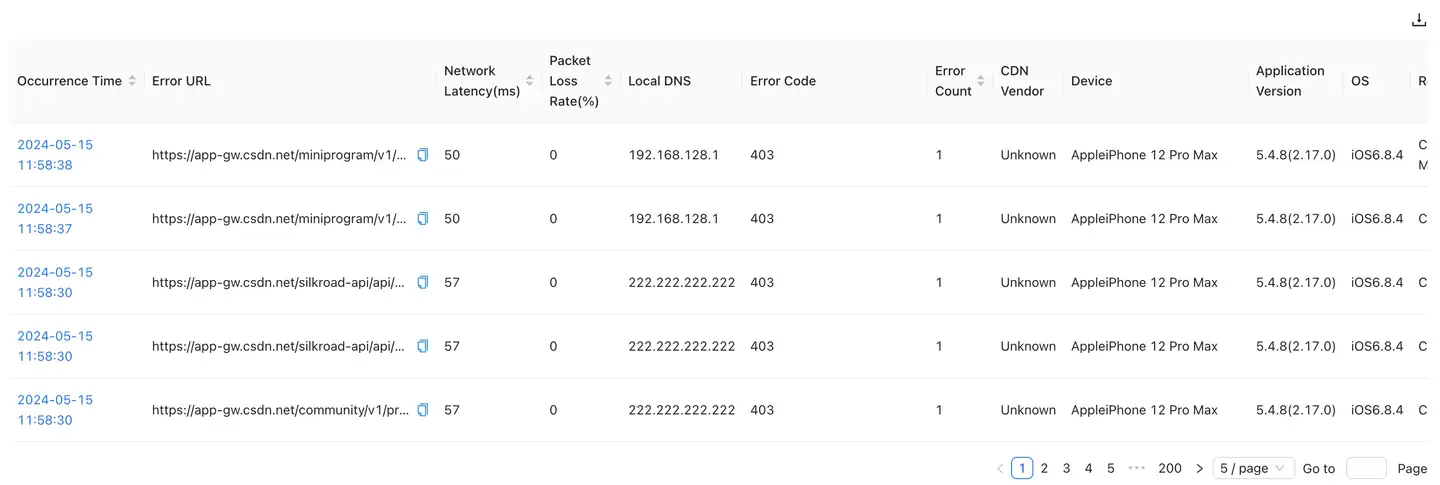
Error detail list: display the performance data related to the request error, including: occurrence time, error URL, network delay, packet loss rate, Local DNS, error code, error quantity, CDN manufacturer, equipment model, application version, operating system version, region, operator, access mode and TraceID.
