Operation analysis
In the operation list, click the link of the operation name to enter the analysis page of the operation. The operation analysis page can be filtered according to the device and operating system, so as to view the user operation experience of a certain brand or model (operating system).
The operation information specifically displays the name of the operation, the time consumed by the operation, the page to which the operation belongs, and the total number of operations.
The operation availability analysis chart can help you intuitively understand the situation when the real user performs the operation, and help you comprehensively evaluate the operation availability.
The operation performance analysis chart comprehensively evaluates the abnormal distribution in the user's use process through the operation time and blocking time, helps you understand the degree of operation flow in real time, and helps optimize the user experience.

The distribution of the operation time consumption can be seen through the histogram of the operation time consumption and the histogram of the blocking time consumption, so as to judge whether the operation affects the user experience.
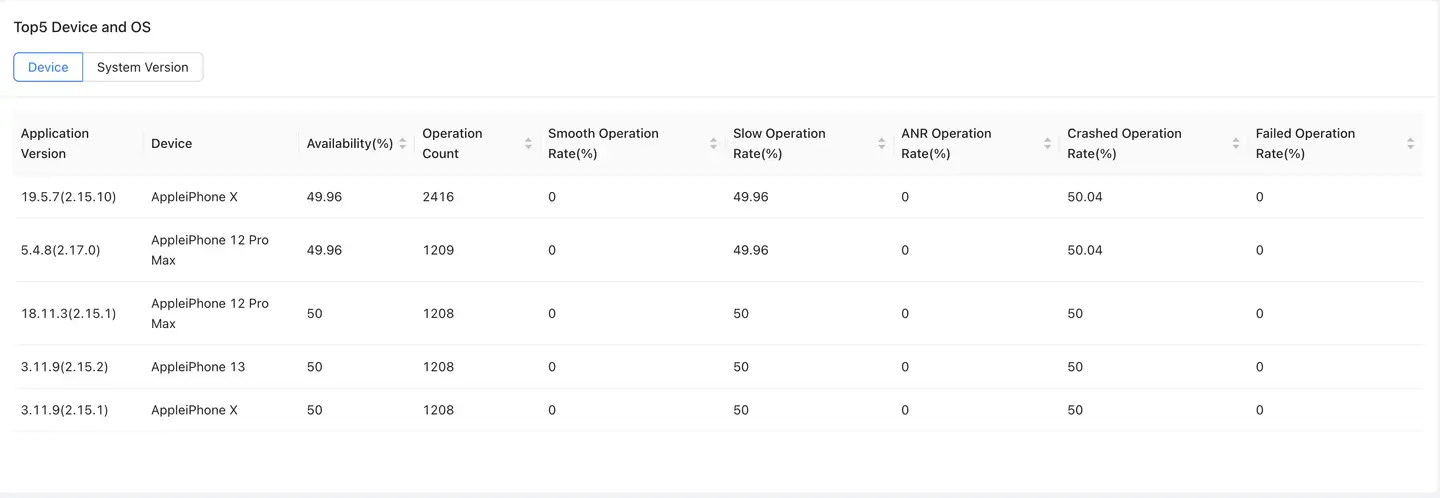
The user experience of the Top 5 devices and systems used in the operation Top 5 devices and operating systems can be analyzed, and the user experience distribution of the operation on the Top devices (operating system) can be intuitively seen through the distribution map of operation times and the distribution map of available times corresponding to the list.

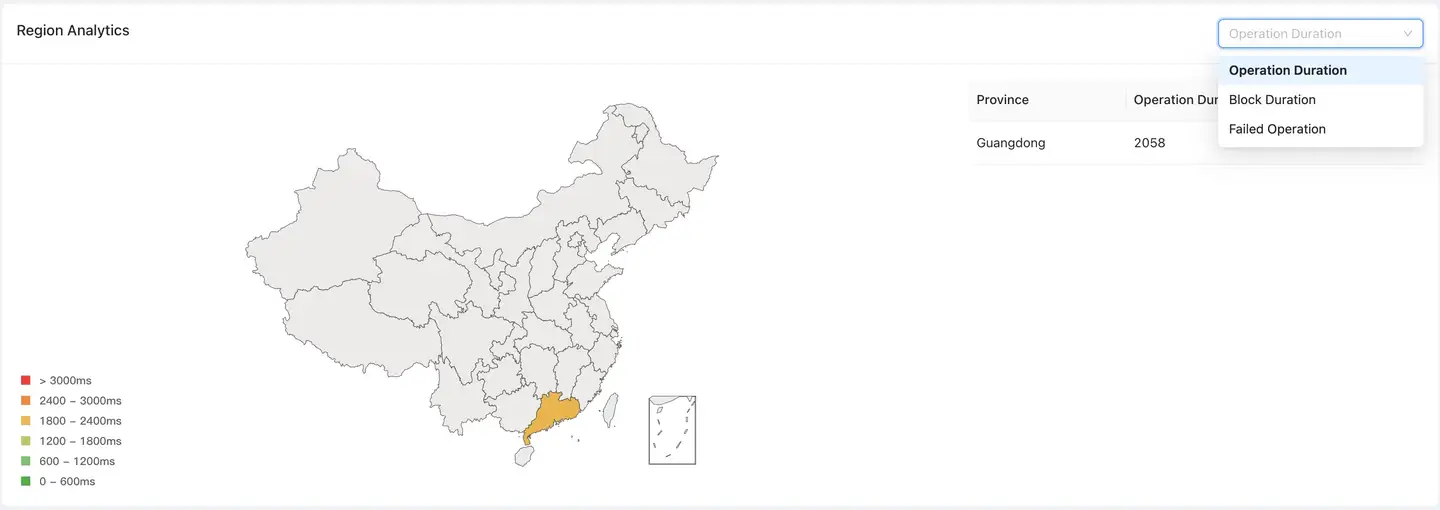
In the map analysis chart, the distribution of operation time consumption, blocking time consumption and failure operation in different regions is displayed.
Segmentation interval:
Operation time/blocking time, divided into 6 sections, marked with different colors, showing the operation performance of 10 provinces.
Failed operations are divided into 6 intervals according to the proportion of failed operations in each province, marked with different colors, and the number of failed operations in 10 provinces is displayed.

Abnormal operation statistics and tracking list It is used to analyze slow, blocking, failure, crash, HTTP error and network error during operation.
- Slow operation/stutter operation
The list displays the occurrence time, UserID, operation time, blocking time, request error number, application version, device, system version, region, operator and access mode. It can be retrieved by UserID for user tracking.
- Failed operation
The list shows the occurrence time of failed operation, UserID, operation time, blocking time, request error number, application version, device, system version, region, operator and access mode. Users can be retrieved by UserID for user tracking.
- Crash statistics

Display crash ID, exception, App version, quantity, crash percentage and status. Click the blue text link in the Crash Details column to drill to the Crash Details page.
- HTTP Error/Network Error
Display HTTP error occurrence time, URL, error information, quantity, and CDN vendor. You can search the list by URL. Click the blue text link in the URL column to drill to the HTTP Error/Network Error Trace page.
Slow Operation/Stuck Operation/Failed Operation Details Part
The slow operation/stuck operation/failed operation details page displays the details of this operation, including operation details, end user information, and waterfall breakdown. The header of the page shows the User ID, the name of the action, and the time it occurred. For a description, see the details of the slow operation trace User Tracing in.
- Crash details page
For a description, see User Tracing the crash tracking details in.
- Error Tracking Details Part
Error tracing displays HTTP errors or network errors that occur during user operations. The list is the sample information of the error sheet, showing the error occurrence time, URL, error quantity, CDN manufacturer, equipment model, App version, SDK version, operating system, region, operator and access mode information. Click the URL link in the list to drill to the error ticket sample details page.
Error ticket sample details include end user information, URL, request parameters, call stack, response header, and response content. End user information includes UserID, error code, occurrence time, operating system, App version, SDK version, equipment model, region, operator, access mode, client IP, server IP, CDN manufacturer and operation name.
The client IP supports IPv6 format display.