Page Analysis
Metrics Definitions
Page Name: The name of the page within the user's visible range. The "Page Name" can be understood as the name of the operation that triggers page navigation. For example, if a user clicks the "Login" button to navigate to the "Login Page," then the current "Login Page" is displayed as "Login" in the Tingyun report.
Page Openings: The total number of times the current page has been opened.
Page Interactive Time: The time from page opening to when the user can interact normally.
Slow Interactive: Pages with interactive times exceeding a predefined threshold, with a default threshold of 1000ms, configurable.
Page First Screen Time: The time from page opening to when the content is fully displayed (including network time).
Slow First Screen: Pages with first screen times exceeding a predefined threshold, with a default threshold of 3000ms, configurable.
Page Slow Interactive Ratio:
Definition: Measures whether the interaction process of the current page is smooth.
Calculation Formula: Slow interactive count / page open count
Page Slow First Screen Ratio:
Definition: Measures whether the content display of the current page is complete.
Calculation Formula: Slow first screen count / page open count
Function Introduction
The Page Analysis allows business personnel to configure the page name directly through the Visualization Naming feature, enabling them to intuitively understand the smoothness and completeness of the first page after the application starts, and grasp the user experience of the page at any time.

Click on the page name to enter the detailed information page, which includes two tabs: Page Interaction and Page Presentation.
The Page Interaction tab mainly analyzes whether the interaction process is smooth, statistically counting the time from the current page opening to when the user can interact.
The chart of the page's slow interactive ratio helps you to grasp the user's interaction experience in real-time. The slow interactive ratio = slow interactive count / open count.

The Page Presentation tab mainly analyzes whether the content display is complete, statistically counting the time from the current page opening to when the content is fully displayed.
The chart of the page's slow first screen ratio helps you to grasp the page presentation experience in real-time. The slow first screen ratio = slow first screen count / open count.
The Time Distribution Chart helps you to understand the average and percentile values of user access to the current page in real-time, facilitating comparative analysis.

The Time Distribution Chart helps you to understand the frequency distribution of interaction time, making it easy to identify differences in frequency between groups and judge the distribution of user experience.
The Page Decomposition Chart helps you to further understand the interaction time of each view (ViewController) that makes up the user-visible interface, analyzing whether the "slow interactive" is caused by the long loading time of a certain view.
The Top 5 Device and Top 5 Operating System analysis helps you to see which devices and operating systems the current page opens most frequently and how the user experience performs.
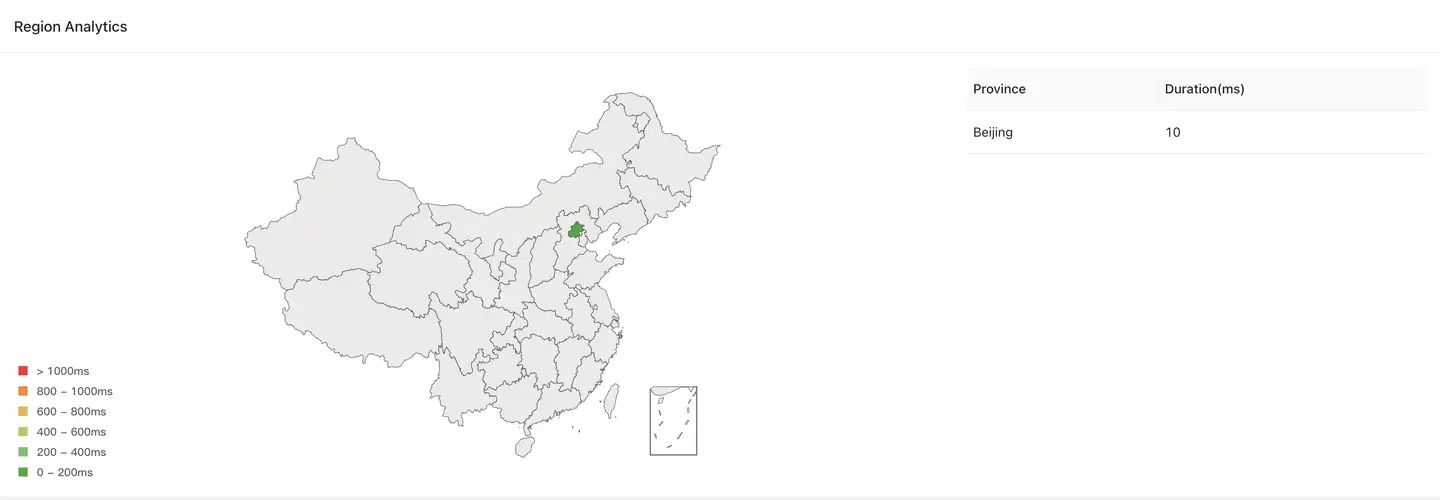
Through Region Analysis, you can clearly understand the user experience in different countries, provinces, and cities.

The Exceptional Page Tracking helps you understand the proportion of slow interactive or slow first screen occurrences in application versions, devices, and operating systems, and provides a detailed single-sample list to help developers locate the root cause of slow interactive or slow first screen samples. The list supports querying based on UserID.

Single Sample Details Analysis
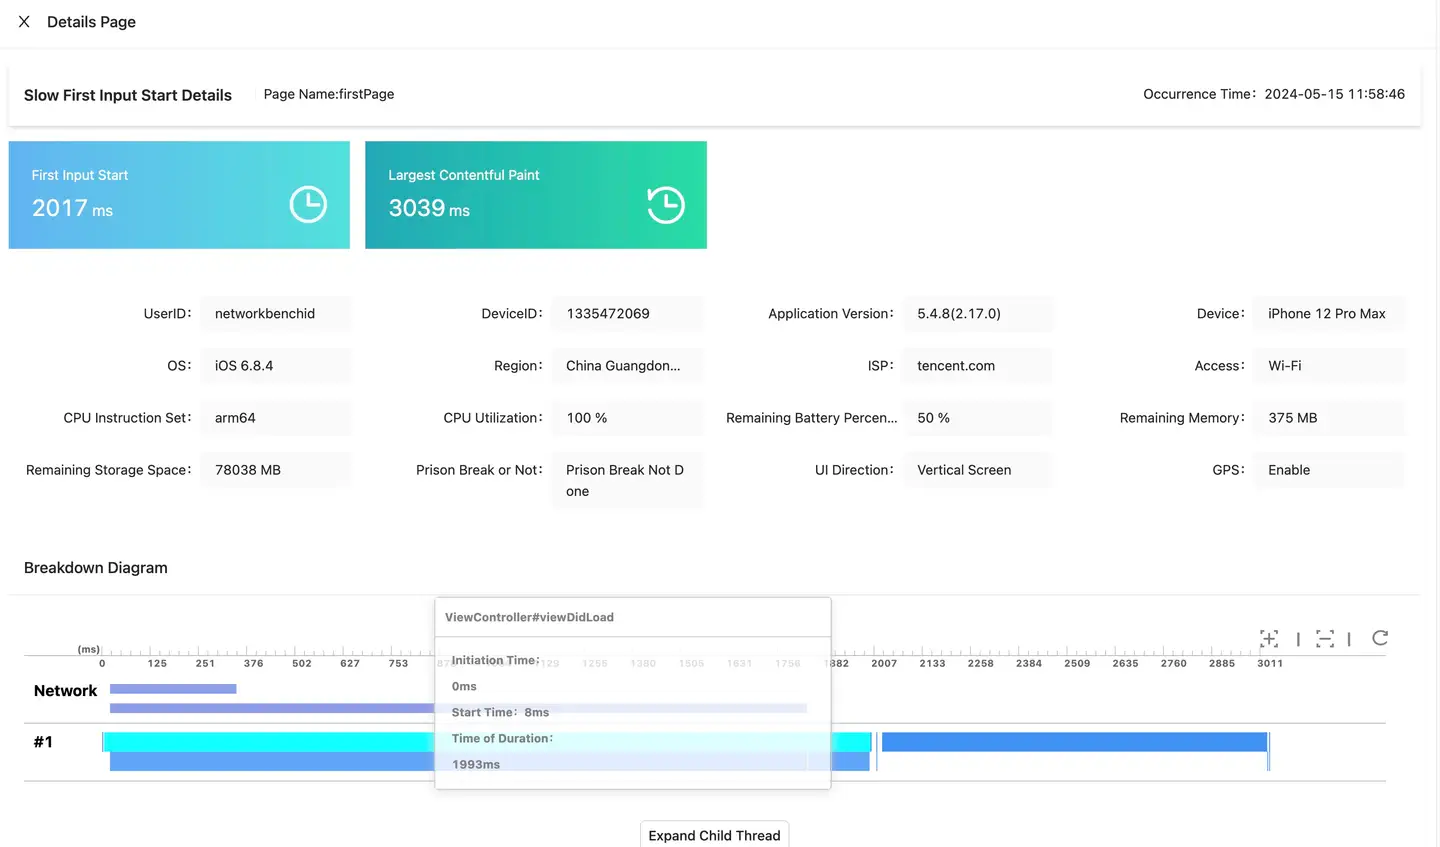
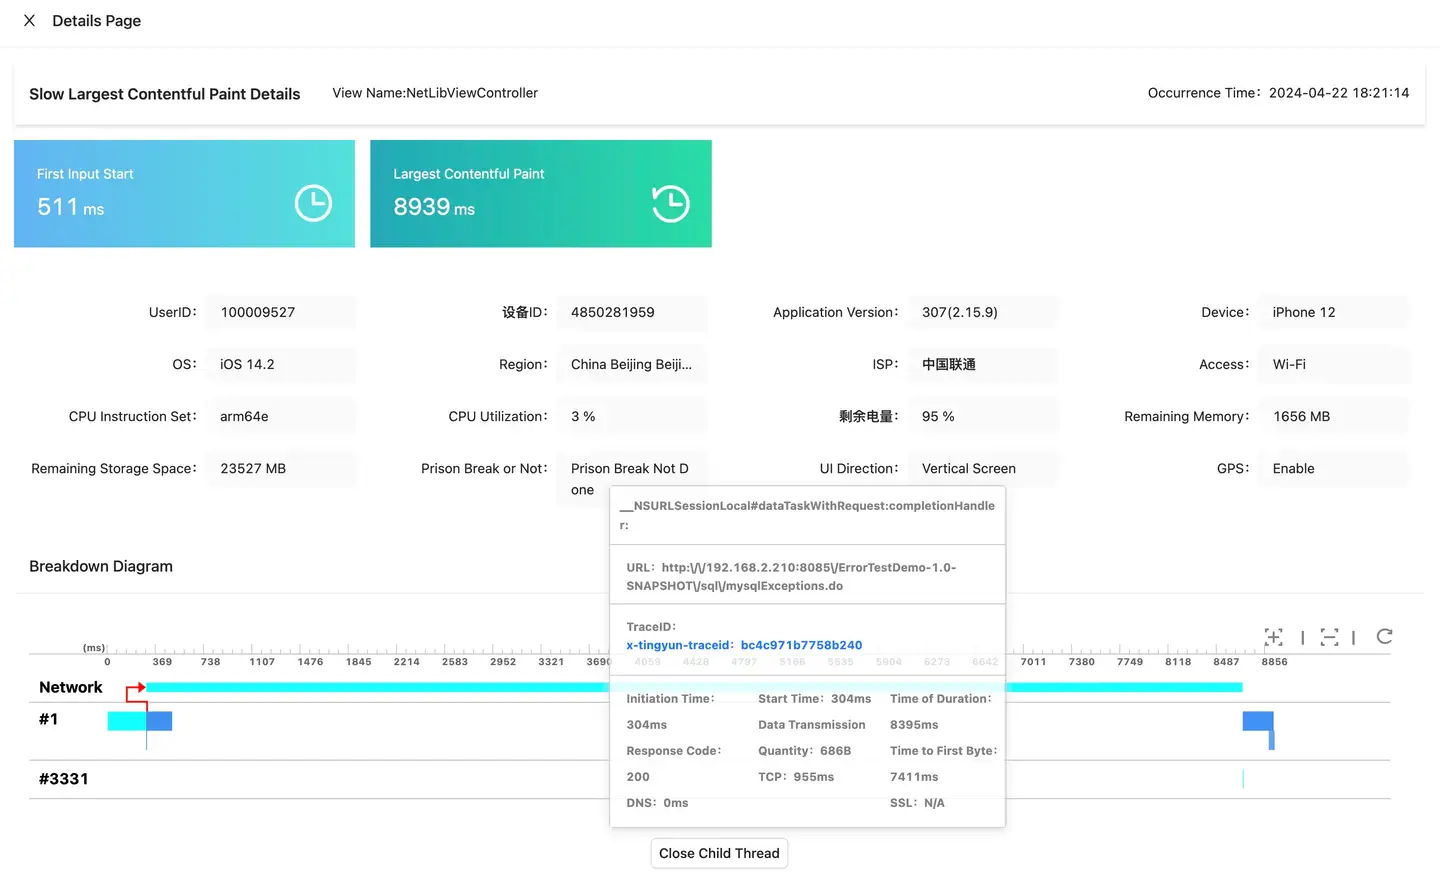
Detailed single sample data is provided for "slow" data to help developers locate the cause of "slow" occurrences. Here are some examples:

Root Cause Analysis: According to the screenshot of the slow interactive Trace, it can be seen that the ViewDidLoad of ViewController takes 1993 ms, which is the cause of this slow interactive.

Root Cause Analysis: According to the screenshot of the slow first screen Trace, it can be analyzed that due to slow network requests, the time taken is long, resulting in a long time for the page to display content.