Network Test
Network test is a troubleshooting tool provided by the Tingyun App for operations personnel. It offers network probing services tailored to real users, assisting operations personnel in understanding the real user network environment. The Tingyun App SDK can execute specific tasks based on different scenarios and dimensions to perform network probing, CDN selection comparisons, and more.

Functions achievable through network probing include:
- Executing TCP Ping tasks for specific scenarios
- Executing ICMP Ping tasks for specific scenarios
- Executing MTR (My Traceroute) tasks for specific scenarios
- Executing single file download tasks for specific scenarios
- Automatically collecting Server IP
- Automatically collecting packet loss rate and network latency data
- Automatically collecting CNAME for obtaining CDN vendor information
Note:The SDK cannot obtain the Server IP for domain name requests. Now, through network probing, it can accurately obtain the Server IP address and simultaneously collect the CNAME information and performance indicator data for the domain name. After turning on the network probing switch, the SDK will execute three Ping commands for each domain name requested by the application within the current 1-minute period to obtain the Server IP, CNAME, and performance data.
Use Cases
-
How to determine if network errors are due to poor client network conditions
By using the TCP Ping/ICMP Ping tasks, you can execute a Ping command for the error domain name after an error occurs to obtain the current network latency and packet loss rate, helping determine if the error is caused by poor client network conditions.
-
How to understand the quality of the client's network link
Through the MTR task, you can promptly understand more comprehensive network diagnostic information. Operations personnel can use it to diagnose and isolate network errors encountered by real users in real-time and provide reports on network status to network operators. When analyzing MTR data, pay attention to two indicators: Packet Loss Rate and Latency. If a certain percentage of loss is seen at any specific hop, this may indicate a problem with that specific router.
-
How to compare CDN selections
By using the single file download task, you can test the acceleration effect of the same resource under different CDN vendors and provide task comparison functionality to view detailed performance data for each node.
Functional Overview
This function is controlled by the Network Test switch. In the navigation bar, select Global Settings, click the Security Settings tab, and then you can see the network probing switch. The network probing function is enabled by default. If you turn off the "Network Probe" switch, the task cannot be executed.

In the navigation bar, select Remote Debugging > Network Test to enter the Probe Task Overview page, which displays all probe tasks and their execution status.
Task List
The task list displayed below shows all created tasks. It supports filtering the list by task status and querying the list based on the execution domain name/URL. The list displays the following information:
Start Time: Time when the current task started issuing.
Task Name: Name of the current task when created.
Task Status: Including four types:
-
In Progress: The current task is in progress.
-
Incomplete: The current task has more execution points than remaining task points.
-
Completed: The current task has been completed.
-
Paused: The task can be paused in the task details page.
Completion Status: Displays the current execution task count and current configured task count.
Execution Conditions:
-
Immediate Execution: After the SDK receives the task, it executes the probe task (single file download task only supports immediate execution scenarios).
-
Execute After Request Ends: After the SDK receives the task, it executes the probe task after the application accesses the "Conditional Domain Name" and the request ends.
-
Execute After Request Error: After the SDK receives the task, it executes the probe task when the application accesses the "Conditional Domain Name" and an error occurs.
Execute Domain/URL:
- Ping tasks (TCP Ping/ICMP Ping) are executed based on domain names.
- MTR tasks are executed based on domain names.
- Single file download tasks are executed based on URL
Performance:
-
For Ping tasks (TCP Ping/ICMP Ping): Network latency.
-
For MTR tasks: Network latency, jitter, hop count.
-
For single file download tasks: Response time.
Availability:
-
For Ping tasks (TCP Ping/ICMP Ping): Packet loss rate.
-
For MTR tasks: Packet loss rate.
-
For single file download tasks: Availability (1 - error task count / total task count).
Operations:
- Copy: Copy the current task, and you need to re-enter the execution time and execution count.
Create Task
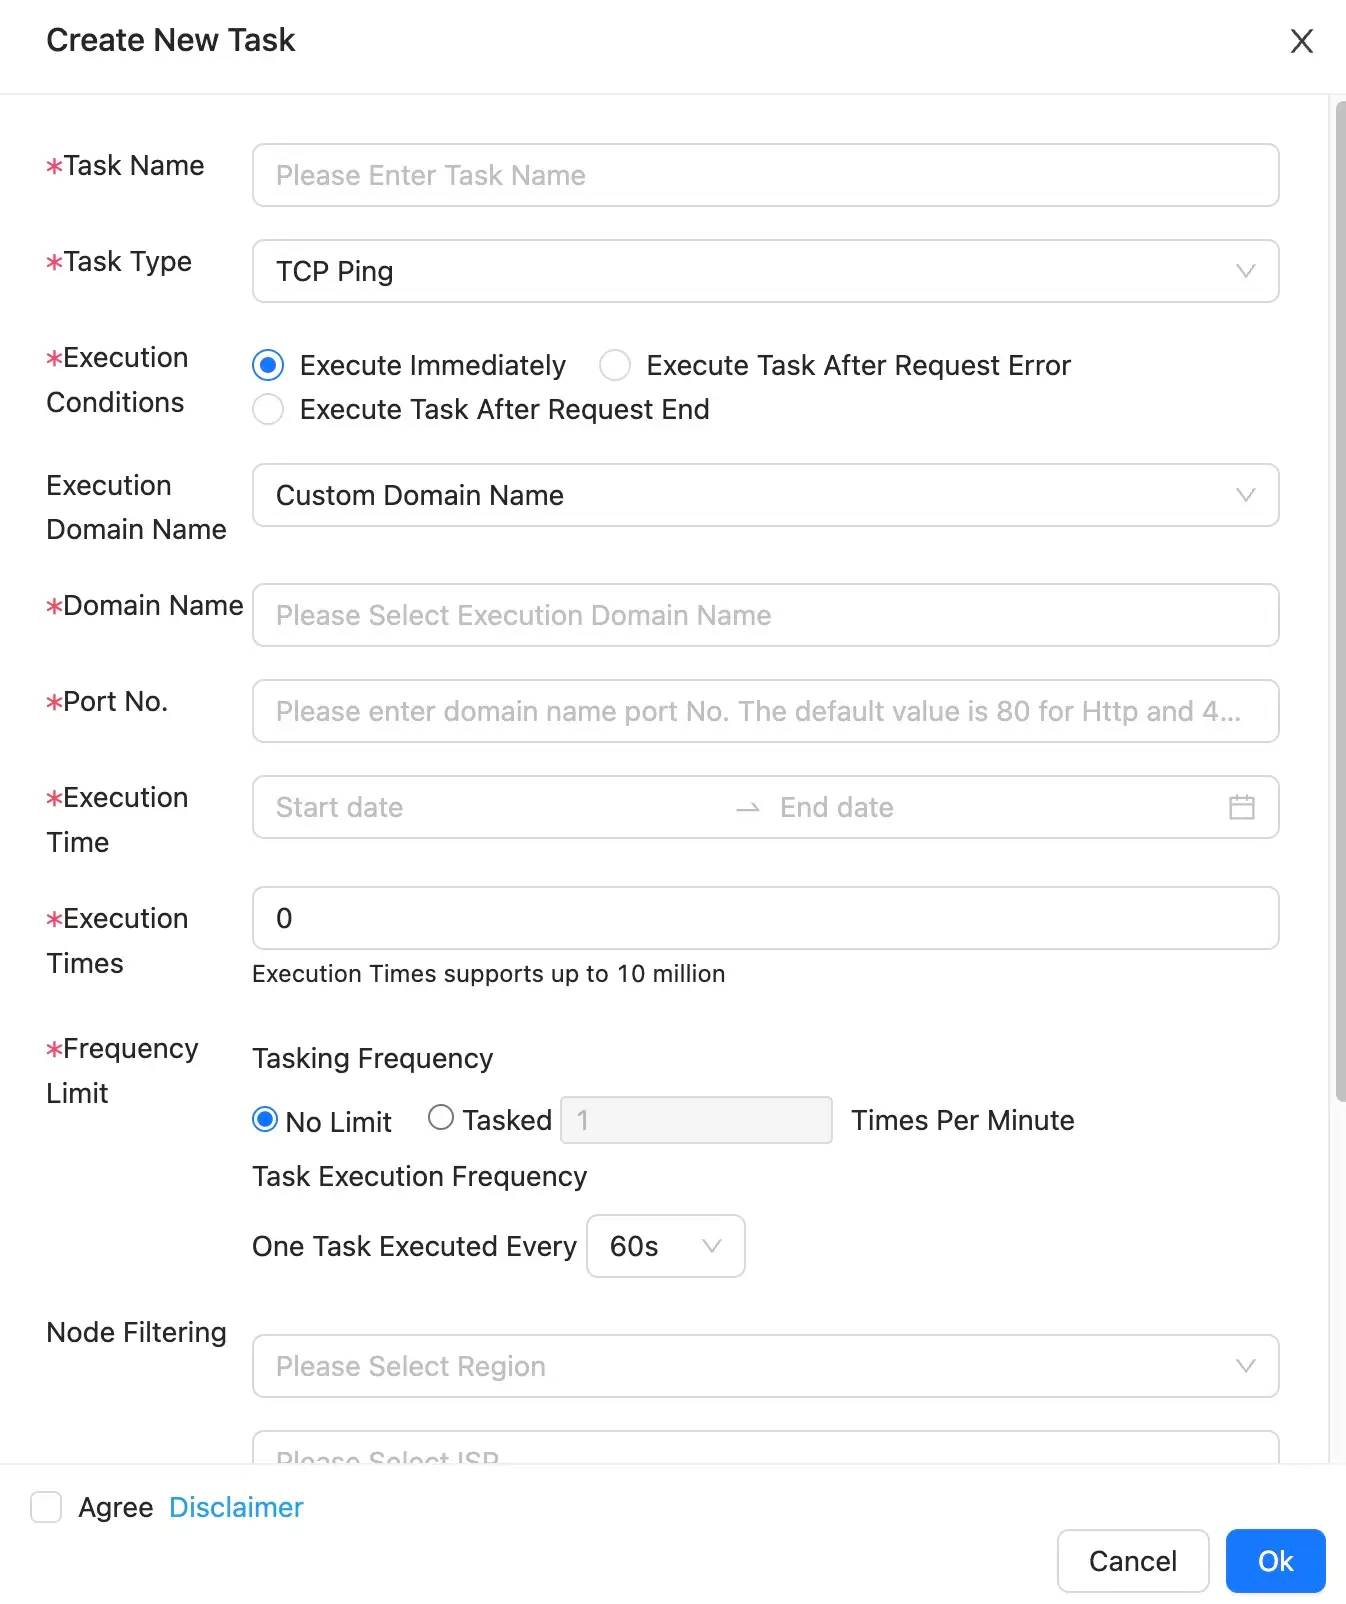
Click the New Task button in the upper right corner of the task list to enter the new task page. Configuration instructions are as follows:

Task Name:Name of the current task.
Task Type:Supports Ping tasks (TCP), ICMP Ping tasks, MTR tasks, and Download tasks.
-
Ping tasks (TCP Ping/ICMP Ping)
- Execution Condition
-
Immediate Execution
- Execution Domain: Custom domain name.
- Domain: Configure the domain name that the current task needs to test.
- Port Number: Configure the port number corresponding to the domain name.
- Execution Domain: Custom domain name.
-
Execute After Request Error
-
Conditional Domain Name: When the App triggers the "Conditional Domain Name", the SDK executes the task based on different conditions. Multiple "Conditional Domain Names" can be entered, separated by commas.
-
Error Type:You can choose to execute the probe task for HTTP errors or network errors. Click the
icon to select error types more granularly. For example, if you select 400, the probe task will only be triggered when a 400 error occurs in the application.
-
Execution Domain
- Custom Domain: Same as the "Immediate Execution" scenario.
- Automatic Identification: The task execution domain is the same as the conditional domain name, that is, after the application requests the conditional domain name, the SDK executes a Ping task for that domain name.
-
-
Execute After Request Ends: Same as "Execute After Request Error" scenario.
-
ICMP Ping (TCP Ping does not support configuring count and packet size)
-
- Ping Count (ICMP Ping only): Supports configuring the number of Ping times for the task, with a default of 3 times, a minimum of 3 times, and a maximum of 100 times.
- Packet Size (ICMP Ping only): Supports configuring the packet size for the task, with a default of 56 Bytes, a minimum of 16, and a maximum of 1024.
- Execution Condition
-
MTR Tasks
-
Execution Condition
- Immediate Execution
- Execution Domain: Custom domain name.
- Domain: Configure the domain name that the current task needs to test.
- Port Number: Configure the port number corresponding to the domain name.
- Execution Domain: Custom domain name.
- Execute After Request Error
-
Conditional Domain Name: When the App triggers the "Conditional Domain Name", the SDK executes the task based on different conditions. Multiple "Conditional Domain Names" can be entered, separated by commas.
-
Error Type: You can choose to execute the probe task for HTTP errors or network errors. Click the
icon to select error types more granularly. For example, if you select 400, the probe task will only be triggered when a 400 error occurs in the application.
-
Execution Domain
- Custom Domain: Same as the "Immediate Execution" scenario.
- Automatic Identification: The task execution domain is the same as the conditional domain name, that is, after the application requests the conditional domain name, the SDK executes a Ping task for that domain name.
-
- Execute After Request Ends
- Same as "Execute After Request Error" scenario.
- Immediate Execution
-
Hop Ping Count
-
Number of times Ping command is executed for each hop, with a default of 10 times, a minimum of 3 times, and a maximum of 100 times.
Note:The more Ping times, the longer the task execution time, and there may be data loss due to the user stopping using the App without completing the task.
-
-
-
Download Tasks
- Execution Condition: Immediate Execution.
- Execution URL: Configure the URL that the current task needs to test.
- Response Header: Enter the response header that needs to be collected, such as User-Agent:1234, please enter User-Agent.
Execution Time:Start and end time of the current task execution.。
Execution Count:Configurable execution count of the current task, with a maximum limit equal to the remaining times of the purchased probing package.
Task Issuance Frequency Limit:
-
No Limitation: Within the specified "Task Execution Time" period, the server issues all task "quotas" at once, and the client executes them when the "task scenario" is met. For example, if the "task execution time" is 13:00~14:00, the "frequency limit" is "no limitation", and the "quota" is 300 times, then the server will issue 300 tasks at once at 13:01.
-
N Times per Minute: The server issues task executions according to the specified frequency set by the customer. For example, if the "frequency limit" is "5 times per minute" and the "task execution count" is 300 times, the server issues tasks 5 times per minute, providing 300 times within an hour.
**Task Execution Frequency Limit:**Choose to execute the probe task every 15s, 30s, or 60s.
Node Filtering:Supports task issuance based on specified dimensions such as region, ISP, and access method (default is all dimensions).
UserID:Supports task issuance targeting specific users.
Task Details
Click the task name in the list to enter the task details page to view detailed information about the current task, including node filtering, task quota, start time, end time, completion count, task status, execution conditions, completion progress, and execution domain. If the task execution needs to be paused for various reasons, click the Pause Task button in the upper right corner.
Task Trend Chart
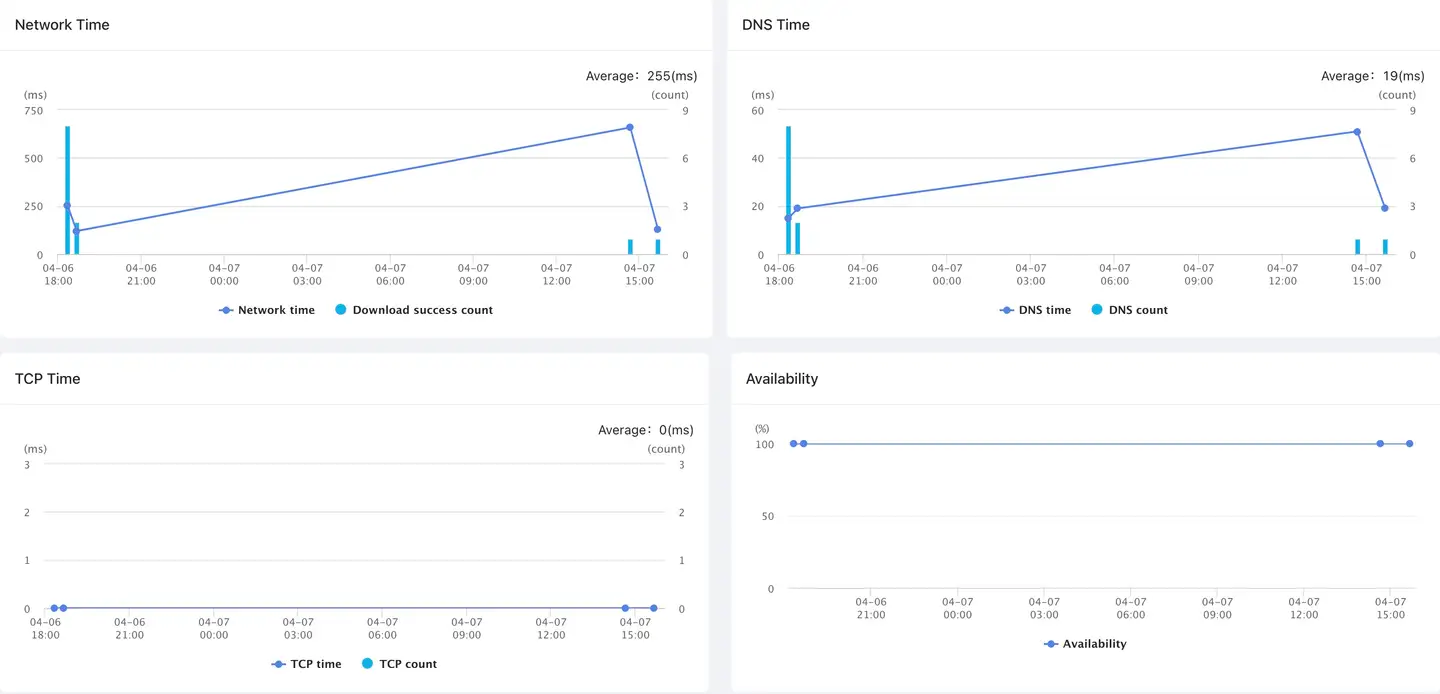
The task trend chart shows the performance indicators and availability of data collected by the current task. The upper right corner of each graph will display the average value of the indicators for the entire statistical period.
Ping Task (TCP Ping/ICMP Ping) Trend Chart: Shows network latency and packet loss rate.

MTR Task Trend Chart: Shows network latency, packet loss rate, hop count, and jitter.
Single File Download Task Trend Chart: Shows network time, DNS time, TCP time, and availability.

Dimensional Analysis
Dimensional Analysisdisplays the top 15 indicator data of all dimensional data collected by the current task. You can combine dimensions arbitrarily, such as region, ISP, and access method.
Task Details
Task Detailsdisplays all single sample data of the current task, and you can filter table data by time and dimension.
Click the icon to add filtering dimensions to the list, supporting User ID, Client IP, Client Region, Client ISP, Server IP, Server Region, Server ISP, Network Time, DNS Time, TCP Time, Response Header, and Error Details. When selecting Remove Options, you can clear the dimension settings.
Click the Reset button to clear all time and dimension settings and restore them to the default state.
Click the icon in the upper right corner to download the current list data to your local device in Excel format, with up to 10,000 data records.

Task Comparison
In the upper right corner of the task details page, you can select tasks of the same type for task comparison. Task execution data, indicator statistics charts, and dimensional analysis will be compared. Up to three tasks can be added for data comparison and verification.
