Large Object Analysis
Large objects refer to "bitmap type single object size greater than 1MB" or "other types of single object size greater than 256KB".
Filter conditions
You can filter data by dimensions such as application version, device, operating system, channel, business scenario, etc.
Large object list
-
The large object list displays the name, average size, number of objects, number of affected devices, and version of the large object under the filter conditions.
-
The large object name supports search, you can click 🔍 to search.
-
The large object list data supports export, you can click the button on the right to export

Large object details
After clicking the large object name, enter the large object details page. The large object details page is displayed in two parts: overview and detailed analysis.
Filter conditions
You can filter data by dimensions such as application version, device, operating system, channel, business scenario, etc.
Overview
Displays the object name, number of objects, and number of affected devices. You can click the link on the right to share.
Detailed analysis
Detailed analysis displays the details of each single sample, including device details and application details.
Device details: UserID, startup time, occurrence time, session duration, device ID, application version, device model, operating system, SessionID, region, operator, access method, page name, business scenario, CPU model, CPU instruction set, device memory, remaining memory, application memory, remaining storage space, UI orientation.

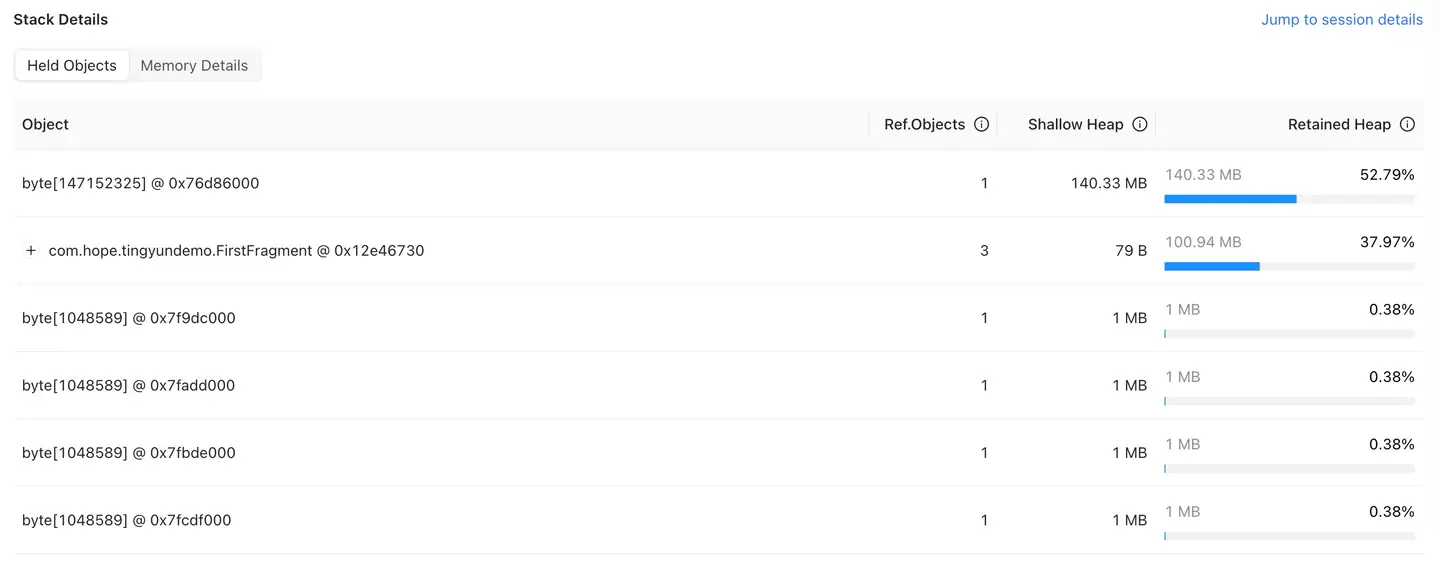
Stack Details
Holding Objects (Root Cause Analysis): First check the Retained Heap. If the Retained Heap is particularly large, and the Shallow Heap itself is relatively small, it means that the held objects have not been released in time. At this time, you need to find which large objects in the response class have not released memory, causing the GC to be unable to reclaim memory.
-
Object (object): The format is "object Class name + memory address" or "object array + memory address".
-
Ref.Objects: The number of objects held, only showing nodes with Shallow Heap greater than 256KB.
-
Shallow Heap: The size of the memory occupied by the object itself.
-
Retained Heap: The sum of all objects that can be removed from the memory by the GC after the object is recycled by the garbage collector. The Retained Heap can more accurately reflect the size of the memory actually occupied by an object.
-
The page supports jumping to Session Details.

Memory Details: Provides detailed memory data related to Android devices, including foreground memory and background memory: physical memory, Java memory usage, video memory, virtual memory, Java memory usage, Java physical memory usage, and Native physical memory usage.
