Energy consumption analysis
Note: Energy consumption analysis is only supported on Android, upload data every 5 minutes.
The energy consumption analysis function can help developers monitor the power consumption of applications in real time, and provide detailed power consumption indicators, power consumption causes and abnormal power consumption analysis data. The usage scenarios and values of this function are as follows:
-
Identify energy consumption bottlenecks Energy analysis lets you know which functions, modules, or operations in your application are the primary source of energy consumption. This helps identify energy bottlenecks in the application and identify critical nodes that need to be optimized.
-
Optimize battery life Energy analysis can help you understand the energy consumption of your application under different usage scenarios. By identifying energy-intensive operations or optimizing low-power strategies, you can reduce the energy consumption of your applications and extend the battery life of your mobile devices.
-
Hardware resource management Energy analysis helps you manage the resources your applications use more effectively, such as GPS, networks, and sensors. By understanding the power consumption patterns of your application, you can develop appropriate resource management strategies that optimize resource use and reduce unnecessary energy consumption and resource waste.
-
Improve the user experience: Excessive power consumption may cause performance problems in mobile applications, such as stuttering, delayed response, etc. Through energy analysis, you can identify performance issues related to power consumption and take action to improve application performance and provide a smoother user experience.
-
Improve application quality By conducting an energy analysis, you can identify potential problems and bottlenecks and improve the design and code implementation of your applications. This helps improve application quality, reduces crashes, stutters, and other problems, and improves application reliability and stability.
Indicator analysis
Filter conditions
You can filter data on dimensions such as application version, device, operating system, and channel.
Trend analysis
It displays the trend chart of the power consumption indicator "foreground amperage, battery temperature" under the filtering condition. The trend chart displays the average value by default. You can filter out the trend chart of any quantile value in "25, 50, 75, 90, 99" on the right side. It supports exporting the data in the trend chart.
Description of indicators:
| Metrics | Explain |
|---|---|
| Front Desk Current Amount | Power value is the core indicator of equipment power consumption, and power value is determined by voltage and current. In general, the voltage value of the equipment is in a stable state, so the trend of the current value can reflect the power consumption of the equipment. When the App is in the foreground, the power consumption mainly comes from the App. When the sample size is large enough to erase the badcase and the App is in the foreground, the current can be used to measure the power consumption of the App. |
| Battery temperature | The battery temperature of the device; a higher battery temperature indicates that the device is consuming more power. |
List of data
The data list shows the value of each segment of the foreground current and battery temperature of each page; you can filter and search the page name and export the list data.

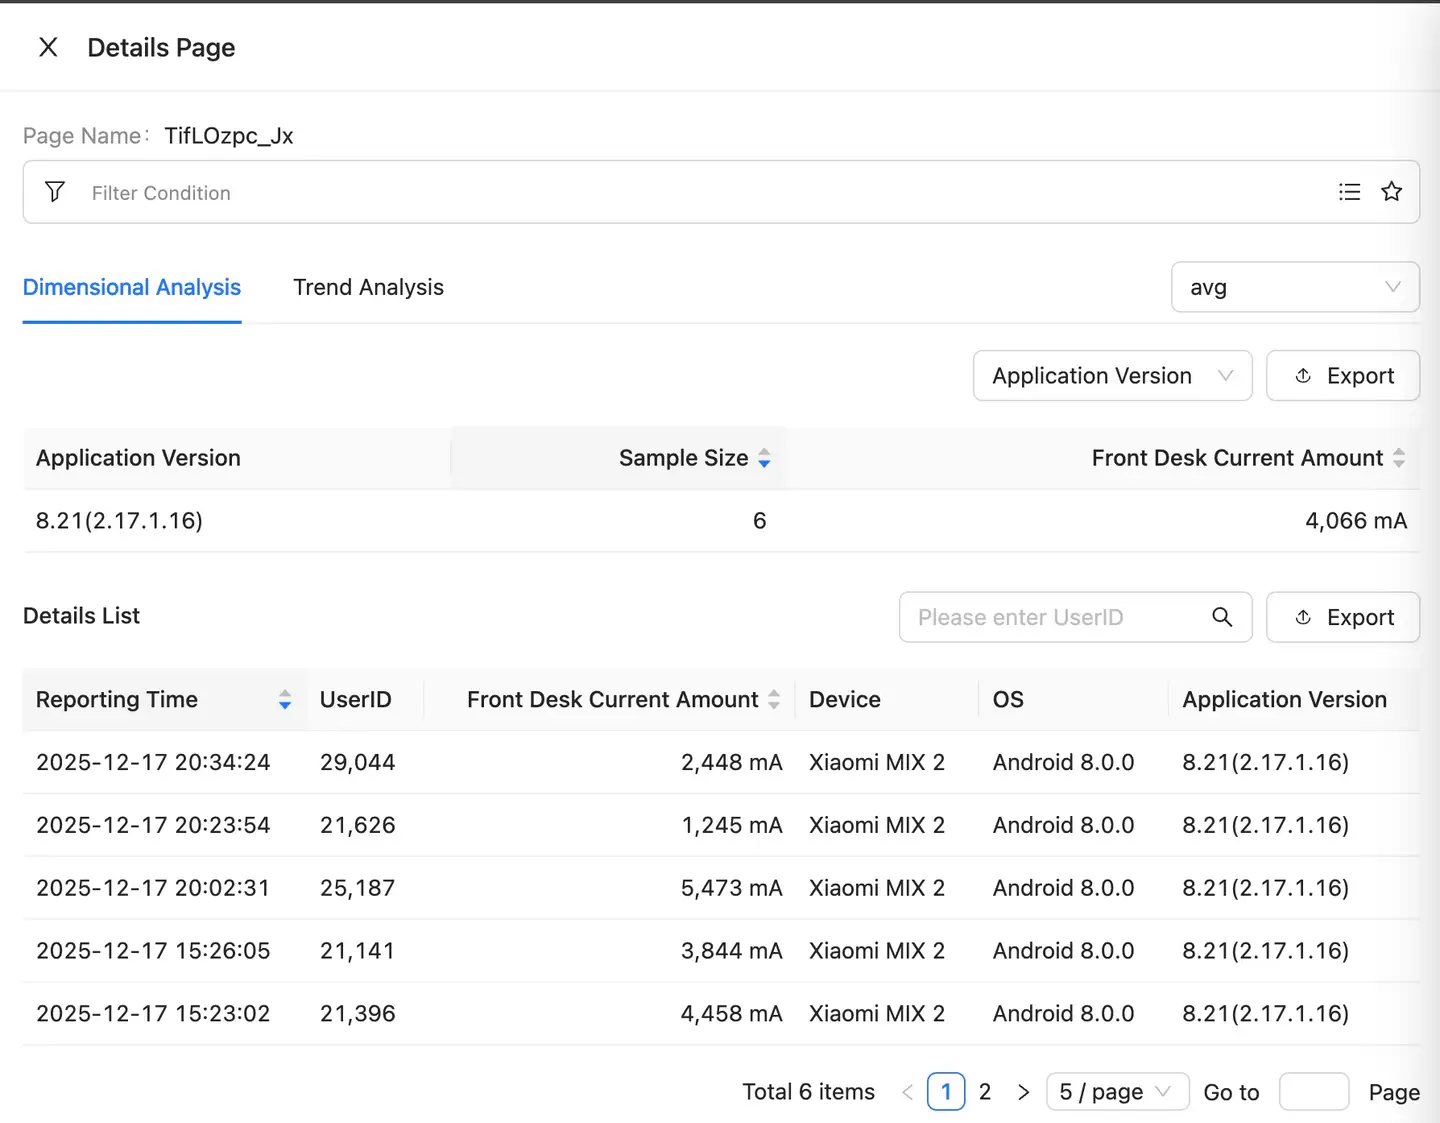
Details page
Display all detailed data of foreground current amount and battery temperature on specific page.
- Dimension analysis: You can filter and analyze dimensions such as application version, device, operating system, and channel.
- Trend analysis: display the power consumption indicator trend chart of the specific page.
- Detail list: displays detailed power consumption data on specific pages.

Attribution analysis
Filter conditions
You can filter data on dimensions such as application version, device, operating system, and channel.
Trend analysis
It shows the trend chart of the power consumption attribution indicator "Traffic, Location acquisition duration, AlarmManager setting times, WakeLock wake-up duration" under the filtering condition. The trend chart shows the average value by default, and you can filter out the trend of any quantile value in "25, 50, 75, 90, 99" on the right side; On the right side of the trend, you can filter data from different dimensions to view the distribution of power consumption attribution indicators.
Description of indicators:
| Metrics | Explain |
|---|---|
| Traffic | Traffic usage, including mobile and Wi-Fi traffic. |
| Get Location Duration | Location Usage Duration |
| AlarmManager Setting Count | The number of times an Alarm of type WakeUp has been raised. |
| WakeLock Wake Duration | The length of time WakeLock is held, the time interval of release WakeLock () -acquireWakeLock () of PowerManager. |

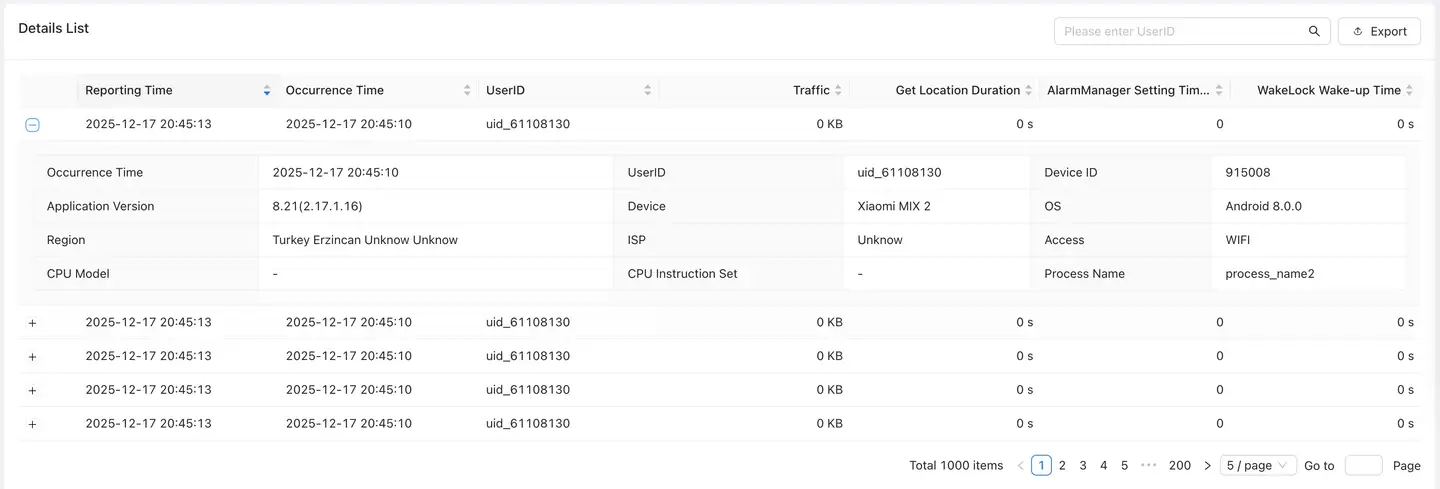
List of details
Display the detailed data of power consumption attribution indicators; list data can be exported. You can click on the + left to expand and view the context information of each piece of power consumption attribution data, including "occurrence time, UserID, device ID, application version, device model, operating system, region, operator, access mode, CPU model, CPU instruction set, and process name".

Anomaly analysis
Filter conditions
You can filter data on dimensions such as application version, device, operating system, and channel.
Trend analysis
Abnormal power consumption: The values of the three indicators, namely, the duration of obtaining Location, the setting times of AlarmManager, and the wake-up duration of WakeLock, exceed the threshold.
In the trend analysis, the trend chart of abnormal power consumption indicators "abnormal times, abnormal rate, number of affected equipment and proportion of affected equipment" is displayed.
Description of indicators:
| Metrics | Explain |
|---|---|
| Exception Count | Number of abnormal power consumption under filtering conditions. |
| Exception Rate | Number of abnormal power consumption under filtration conditions/total number of starts under filtration conditions. |
| Affected Device Count | The number of devices with abnormal power consumption under filtering conditions is "de-duplicated". |
| Affected Device Percentage | Number of devices with abnormal power consumption under filtering conditions "de-duplication"/Number of active devices under filtering conditions "de-duplication". |
List of exceptions
Display the detailed data of power consumption exceptions, and the list supports export; the exception problem classification is aggregated and classified according to the first line of App call stack of the collected exception thread stack.
You can filter the data by filtering the following dimensions:
Filtering dimensions: exception stack, exception ID, userID, handler, label, exception type, and exception status

You can click the exception problem to enter the exception details.
Exception details
Details of each abnormal power consumption problem are displayed, mainly including:
- Exception type, information
- Exception List: the detailed data of the exception.
- Device Statistics: the distribution of devices with exceptions. You can filter on the right. The filtering dimensions include device, operating system, device ID, CPU instruction set, and application version.
- Anomaly trend: The trend of the number of occurrences of anomalies and the number of affected devices.
- Context information: UserID, exception occurrence time, session duration, device ID, application version, device model, operating system, region, operator, access mode, CPU model, CPU instruction set, device memory, remaining memory, memory occupied by application, remaining storage space and UI orientation.

- Stack information: The thread call stack information where the exception occurred.

- Anomaly traceback: The occurrence of an anomaly is a triggered trace.

- Custom information: information for calling
NBSAppAgent.setUserCrashMessage(String key,String value);settings
Power Consumption Exception Threshold Settings
Click "Application List"- "Settings"- "Energy Consumption Settings" to enter the energy consumption setting page. You can change the threshold of abnormal power consumption according to actual needs.


Default threshold:
| Metric Name | Configuration Details | Supporting instructions |
|---|---|---|
| Maximum Duration of Single Location Usage | 120 | How long is the location used for a single time as an exception report? The unit is second. |
| Number of Location Acquisitions within 10 Minutes | 4 | Locate and use several times within 10 minutes as an exception report. |
| Location Query Duration within 10 Minutes | 240 | Locate how long it will be used as an exception report within 10 minutes, in seconds. |
| Single Wake Lock Hold Duration | 5 | How long the wake lock is held at a time is reported as an exception, and the unit is second. |
| Number of Wake Lock Acquisitions within 10 Minutes | 240 | The wake lock is obtained several times within 10 minutes and reported as an exception. |
| Wake Lock Hold Duration within 10 Minutes | 120 | How long the wake lock is held within 10 minutes is reported as an exception, and the unit is second. |
| Number of Wake-up Type Alarm Triggers within 10 Minutes | 5 | Alarm (wake _ up type) wakes up several times within 10 minutes and is reported as an exception. |
| Number of Alarm Triggers within 10 Minutes | 10 | Alarm wakes up several times within 10 minutes and reports it as an exception. |
Energy consumption analysis index collection support matrix
| Indicators | Supported OS Versions |
|---|---|
| Front Desk Current Amount | Android 5+ |
| Battery temperature | Android 5+ |
| AlarmManager | Android 5+ |
| WakeLock | Android 5+ |
| Traffic | Android 6+ |
| LocationManager | Android 5 ~ 12 |