Exception Launch Statistics and Tracking
Exception Launch Statistics and Tracking display exceptional issues encountered during initial launch, cold launch, and hot launch, including trends and information lists for slow launches, crashes, HTTP errors, and network errors. Click on the tabs in the upper left corner to switch between them.
Statistics
Slow Launch Statistics
A slow launch is defined as a launch with a startup time greater than the threshold, which defaults to 3000ms. Bar and line graphs depict the proportion of slow launches, the number of slow launches, and the number of excellent launches for initial, cold, and hot launches.

Three tables respectively show the distribution of slow launches by app version, device model, and operating system.
A list displays the occurrence time, User ID, launch time, app version, operating system, and device model of slow launches. The list can be searched by User ID. Clicking on any slow launch entry leads to the slow launch tracking page.

Crash Statistics
Bar and line graphs show the crash rate, the number of crashes, and the number of launches for initial, cold, and hot launches. The list aggregates data by exception message and trace information, displaying exception ID, exception issue, app version, the time of the most recent reported exception, the number of times the exception occurred, the number of users affected by the exception, and the exception handling status. Clicking on the blue text link in the Exception Issue column drills down to the Exception Details page. The list supports queries based on handler, tags, exception handling status, exception stack, exception ID, exception name, and User ID. Below the Exception Issue section, clicking the Add Tag button allows tagging of the current exception for marking purposes, supporting multiple tags. After selecting multiple issues, the handling status can be modified in batch.

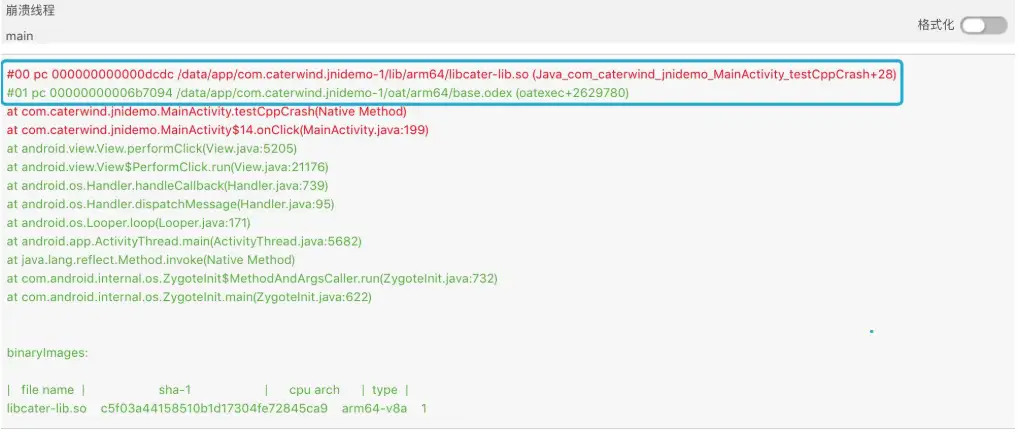
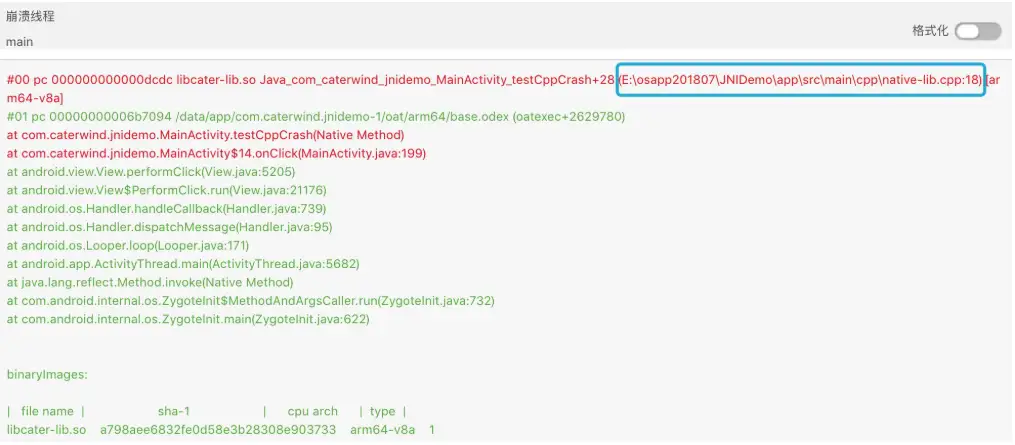
To accurately locate the code where native crashes occurred, Tingyun uses symbol table files to parse and restore crash stacks. Clicking Symbol Management in the upper right corner of the crash list allows for uploading symbol table files, with automatic upload support. The restoration effect is demonstrated below:
Original Stack:
Restored Stack:
Note:Only system administrator users can upload symbol table files.
For specific upload instructions, please refer to Symbol Management。
HTTP Error Statistics
A bar graph shows the HTTP error rate, the number of errors, and the number of requests for initial, cold, and hot launches. The list aggregates data by URL and error information, displaying the time of HTTP error occurrence, the error URL, the number of errors, CDN provider, device model, app version, operating system version, region, carrier, and access method. The list can be searched by URL. Clicking on the blue text link in the URL column drills down to the HTTP error tracking page.
Network Error Statistics
A bar graph shows the network error rate, the number of errors, and the number of requests for initial, cold, and hot launches. The list aggregates data by URL and error information, displaying the time of network error occurrence, the error URL, the number of errors, CDN provider, device model, app version, operating system version, region, carrier, and access method. The list can be searched by URL. Clicking on the blue text link in the URL column drills down to the network error tracking page.
Tracking
Slow Launch Tracking
For detailed descriptions, refer to Slow Launch Tracking Details in User Tracking.。
Crash Tracking
Crash details display detailed information about crashes occurring during initial, cold, and hot launches, including crash information, exception lists, and exception trend charts.
The header displays crash information, including the number of crash occurrences, affected devices, and repair status.
Exception List Tab: Displays records of each exception occurrence. Clicking on a record displays the context information at the time of the exception occurrence, including device startup time, exception occurrence time, User ID, device ID, app version, operating system, and device model.
Device Statistics Tab: Displays a bar chart of crash occurrences by device model across various dimensions, allowing users to view crash occurrences and affected devices to pinpoint devices/operating systems with the highest crash rates and understand which devices experience the most crashes, facilitating targeted optimization.
Device Dimension:
Operating System Dimension:
Device ID Dimension:
Context Information: Displays environmental information at the time of the crash event, including User ID, device ID, device model, operating system, app version, region, carrier, access method, device memory, application memory usage (percentage), remaining memory (percentage), remaining storage space (percentage), CPU model, CPU instruction set, and UI orientation.

Stack Information: Displays the origin and immediate cause of the crash event (a icon indicates that no symbol table file has been uploaded for the current version or symbolization has failed).
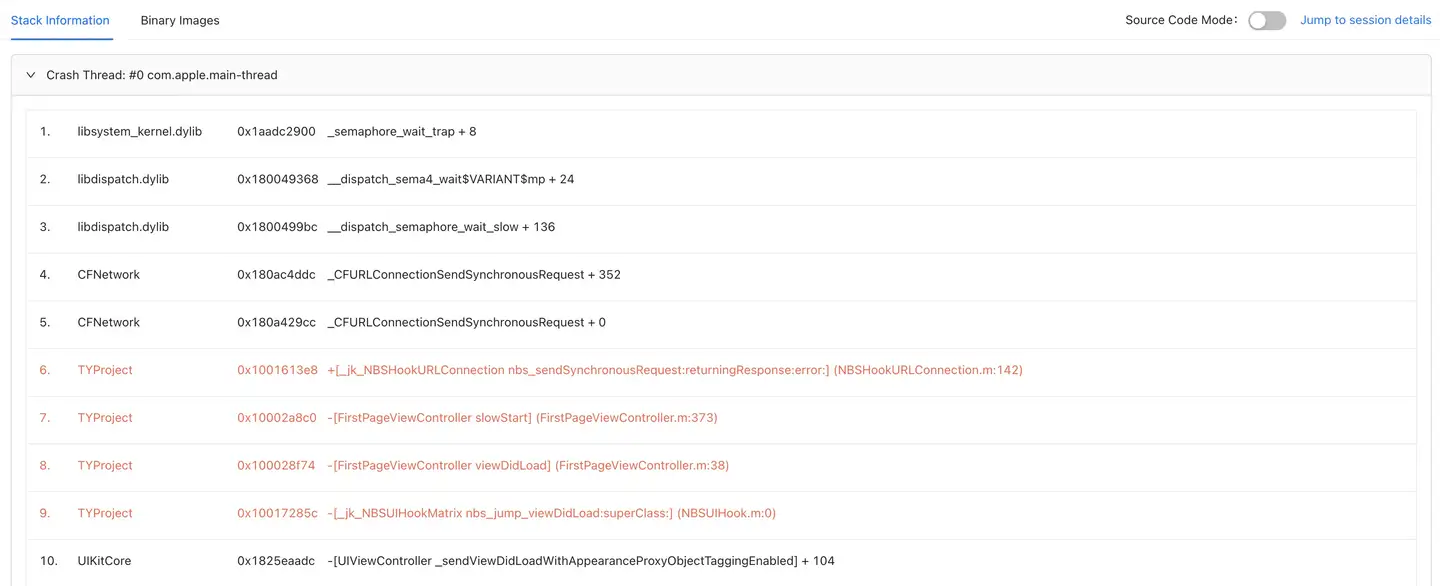
Custom Information: Users can add up to 10 custom pieces of information, each containing up to 100 bytes, at any point after the Tingyun SDK is started, such as real user account and contact information.
Addition Method:NBSAppAgent.setUserCrashMessage(String key,String value);
System Logs: For the Android SDK, users can define system logs. After definition, a System Logs tab is added to the Crash Details page.

Exception trend charts display changes in crash occurrences and affected devices.
HTTP Error Tracking
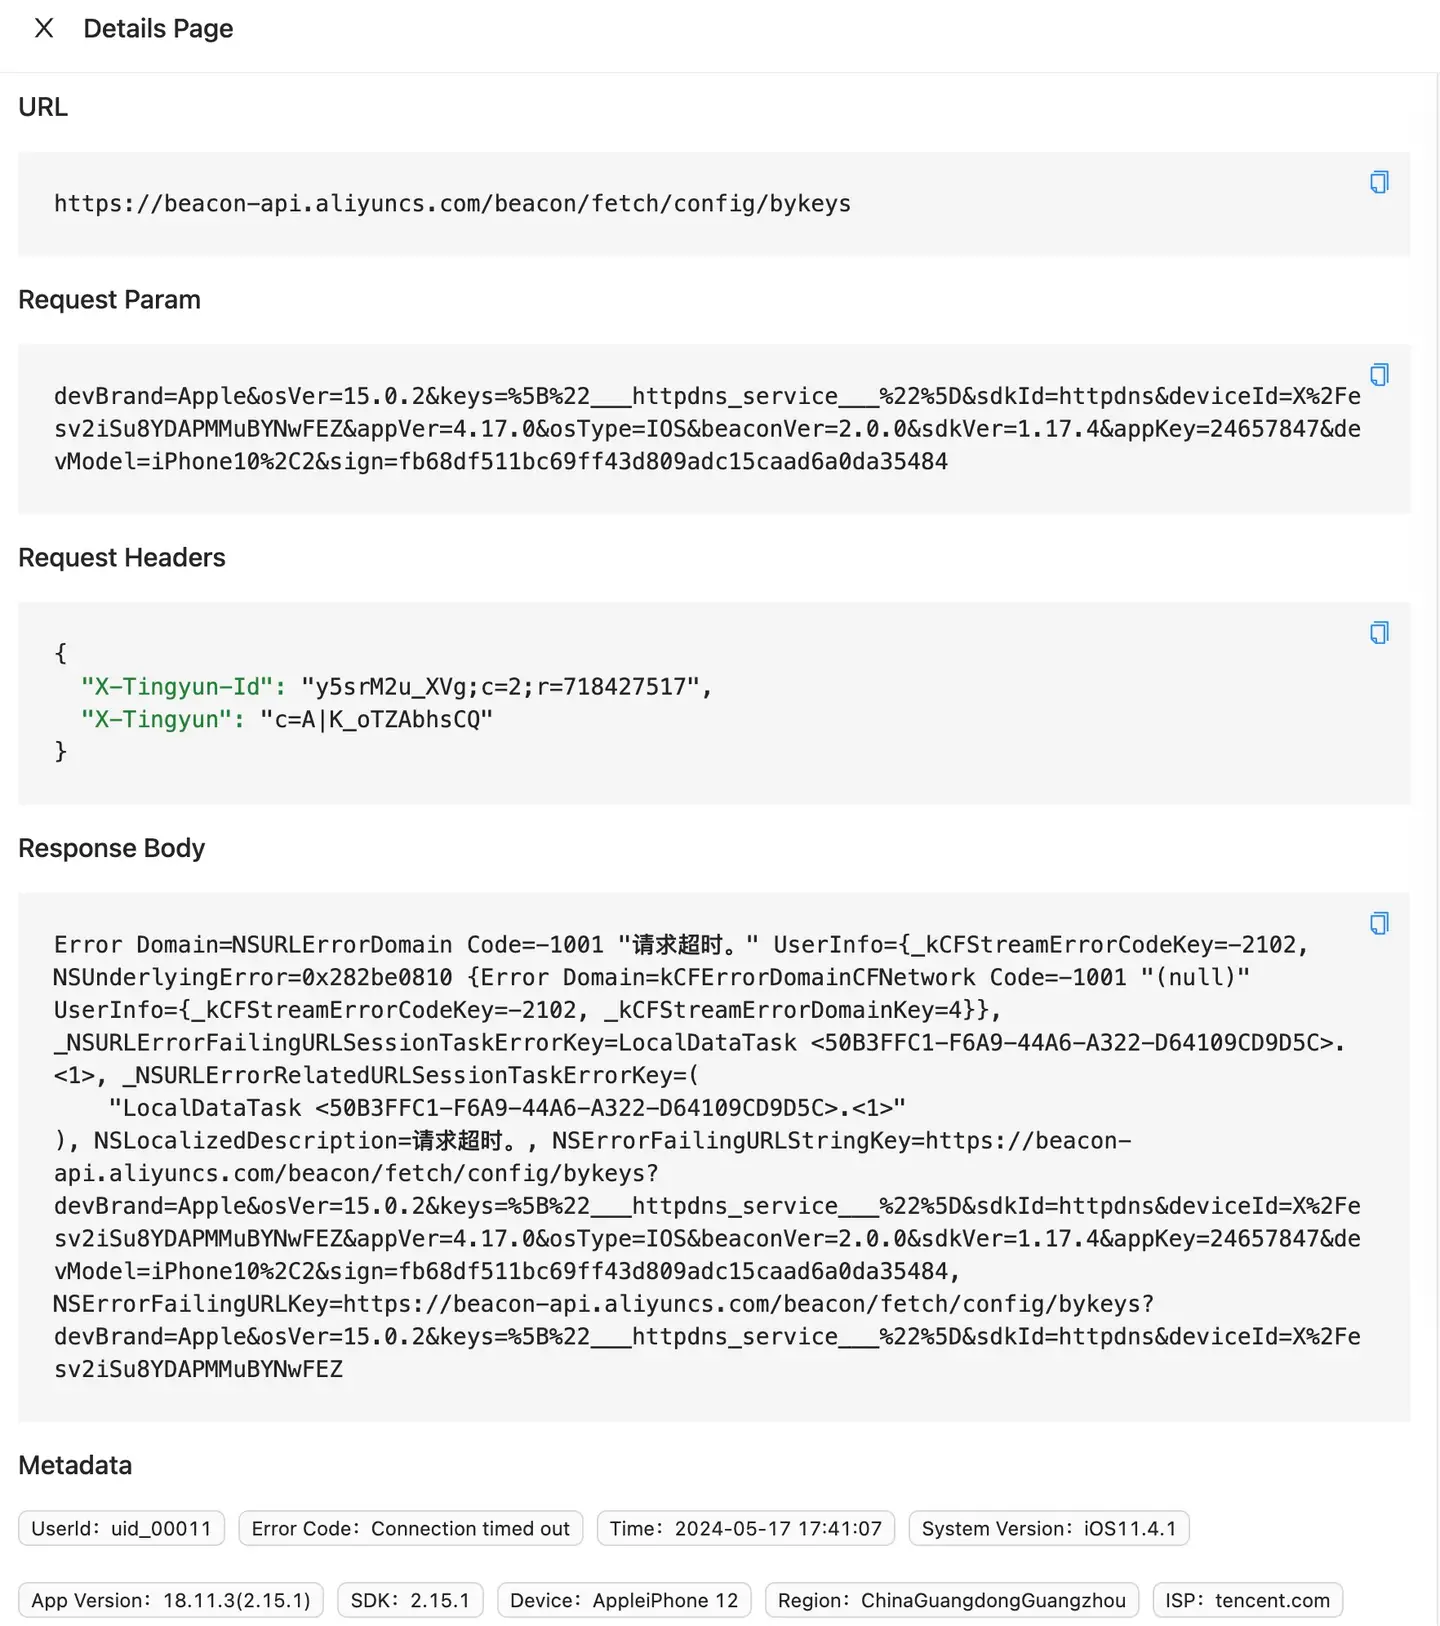
A single HTTP error detail includes terminal user information, URL, request parameters, call stack, response headers, and response content. Terminal user information includes User ID, error code, occurrence time, operating system, app version, SDK version, device model, region, carrier, access method, client IP, server IP, CDN provider, and operation name (method name).
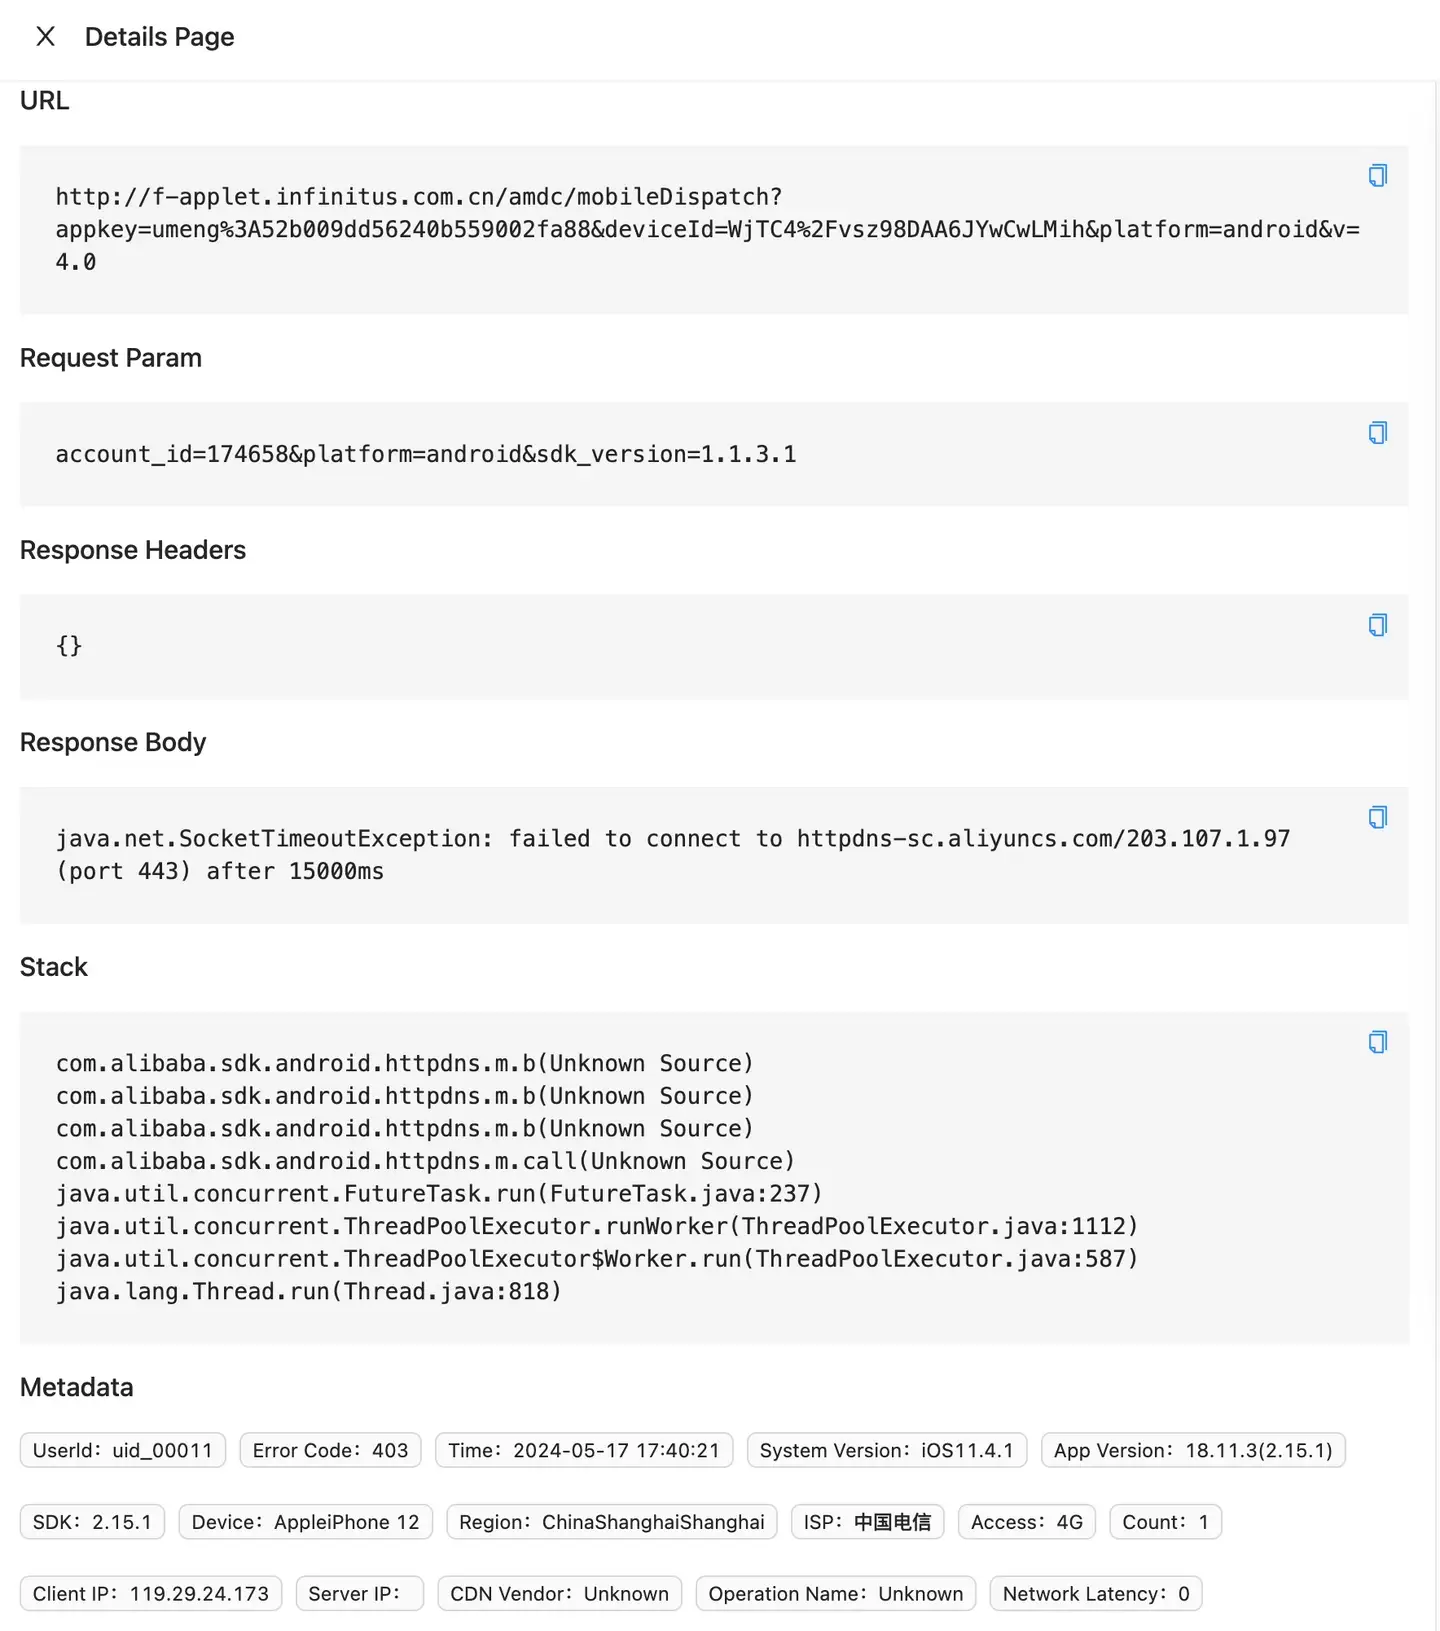
Network Error Tracking
A single network error detail includes terminal user information, URL, request parameters, call stack, response headers, and response content. Terminal user information includes User ID, error code, occurrence time, operating system, app version, SDK version, device model, region, carrier, access method, client IP, server IP, CDN provider, and operation name (method name).
