Session analysis
Session analysis will integrate all the operations performed by users on multiple terminals, and comprehensively analyze the user's jump between small programs, browsers and mobile applications in the session dimension, so as to understand the user's usage habits. If you want to analyze session data from a single source, such as a mobile app or browser, you can filter by global filter criteria.
Explanation of terms
A session (aka "access path") is a series of continuous interactions that a user makes in an application that occur within a limited time frame. In a single session, users may perform multiple actions, such as browsing different pages, initiating requests for third-party content, interacting with services, and performing various user-defined actions. Each user session contains at least one such action. The User Journey > Session Analytics feature provides insight into and analysis of data across a variety of session dimensions, which can help identify user behavior patterns, optimize the user experience, and further improve application performance.
The start and end of the session are described as follows:
-
Session start: The first user action after the application is started is taken as the start point of the session.
-
End of session
- App side
- Mobile device is idle for 10 minutes
- When the user actively shuts down the operating system or forcibly stops the application
- When the call to the startNextSession interface ends
- Web side
- Browser inactive for 35 minutes
- When the user closes the browser
- When the session lasts up to 8 hours
- When the call to the startNextSession interface ends
- App side
Other performance indicators are described as follows:
-
User session: Record a complete and purposeful sequence of user interactions.
-
Session duration: counts the time from the start point in the session to the completion of the last interaction in the session.
-
Interaction times: count the total times of application startup, click operation and page loading generated by the user in the session.
-
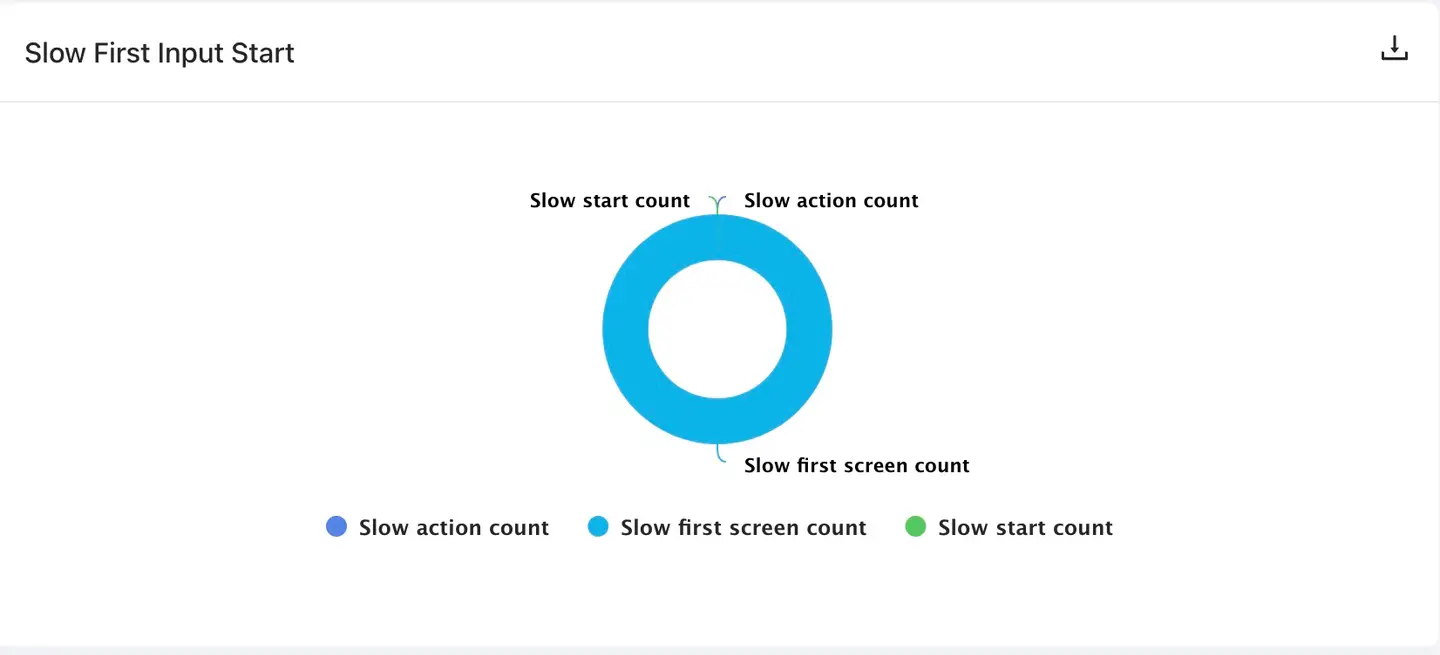
Slow interaction: An operation whose interaction time is greater than the configured threshold is defined as a slow interaction, including three types: slow start, slow operation, and slow first screen.
-
Events: Records the total number of System Events, Exception Events, and Custom Events that occurred in a user session.
- System event: including foreground and background switching and network switching (5G switching to WiFi).
- Exceptional events: including crashes, stutters, JS errors, and brute force clicks.
- User-defined events: include user-defined business events and user-defined error events (user-defined events need to be uploaded by calling related interfaces provided by the SDK).
-
Number of users: statistics are made according to the UserID configured by the R & D personnel. If the UserID is not configured, statistics are made according to the DeviceID generated by the Tingyun, that is, one device is equal to one user.
-
Violent click: The user clicks the screen quickly in a short time (more than 3 clicks within a certain radius on the screen, and the maximum interval between consecutive clicks is 300ms), which reflects the user's "anxiety" to a certain extent, and is an important indicator for analyzing the user experience.
-
Stay time: Record the time that the user stays on the page naturally.
Session overview
Indicator card
-
Number of sessions: displays the total number of sessions in the currently selected time period.
-
Number of active users: displays the number of users who have started once in the currently selected time period.
-
Average session duration: calculate the ratio of the total session duration to the number of sessions in the current time period (arithmetic average).
-
Average number of interactions: shows the ratio of the number of interactions to the number of sessions in the currently selected time period (arithmetic average).
-
Average number of events: displays the ratio (arithmetic average) of the number of events to the number of sessions in the currently selected time period.
-
Annular comparison of the previous time period: The platform will compare the data of the current time period with the data of the previous time period to show the change of the indicator. Examples are as follows:
- The current time period is from 13:00 to 14:00, and the number of sessions is 100.
- The last time period was from 11:00 to 12:00, and the number of sessions was 80.
- The month-on-month comparison result is: (the number of sessions in the current period-the number of sessions in the previous period)/100 = (100 - 80)/80 100 sessions in the previous period = 25%

Statistical chart
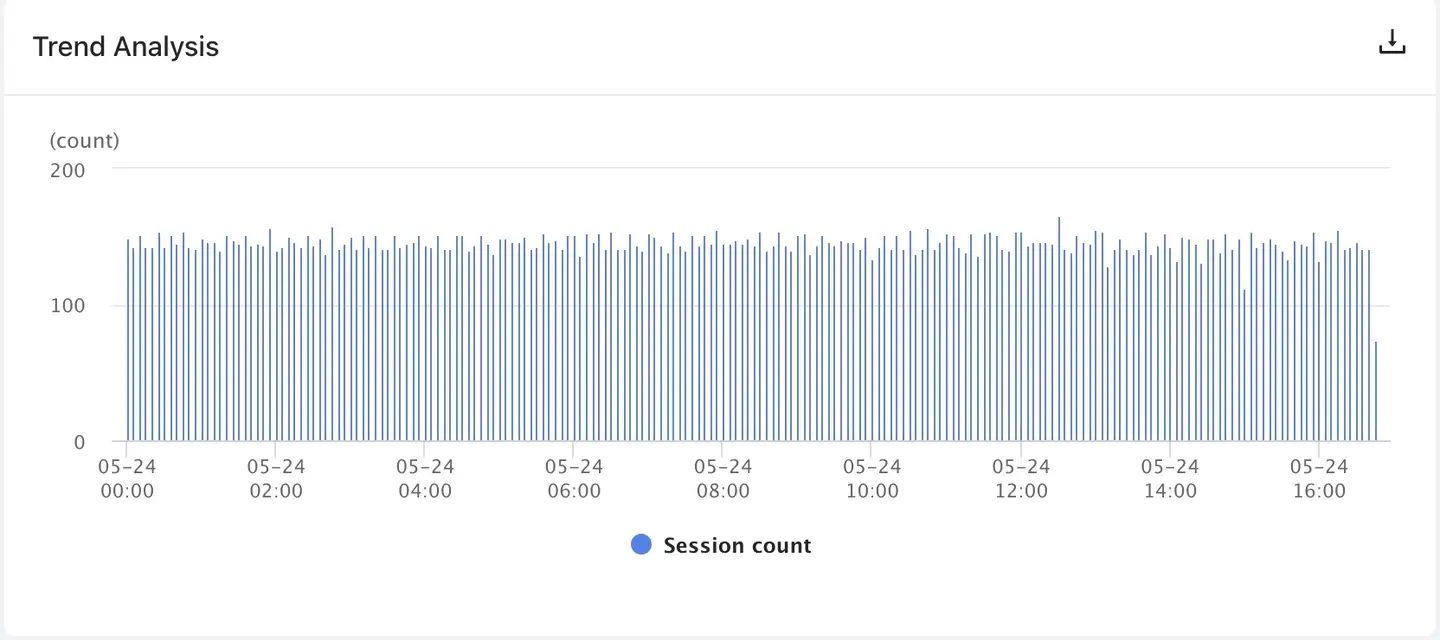
Trend analysis chart: It shows the change relationship of the indicator according to time, and supports multi-dimensional filtering and downloading.
Source Distribution/User Distribution Map: displays the channel source distribution and user distribution of the indicator, and supports multi-dimensional filtering and downloading.
-
Source distribution: The platform identifies the source according to the first operation in the session and calculates its proportion.
-
User distribution: The platform will count the number of de-duplicated users according to different sources and calculate their proportion.
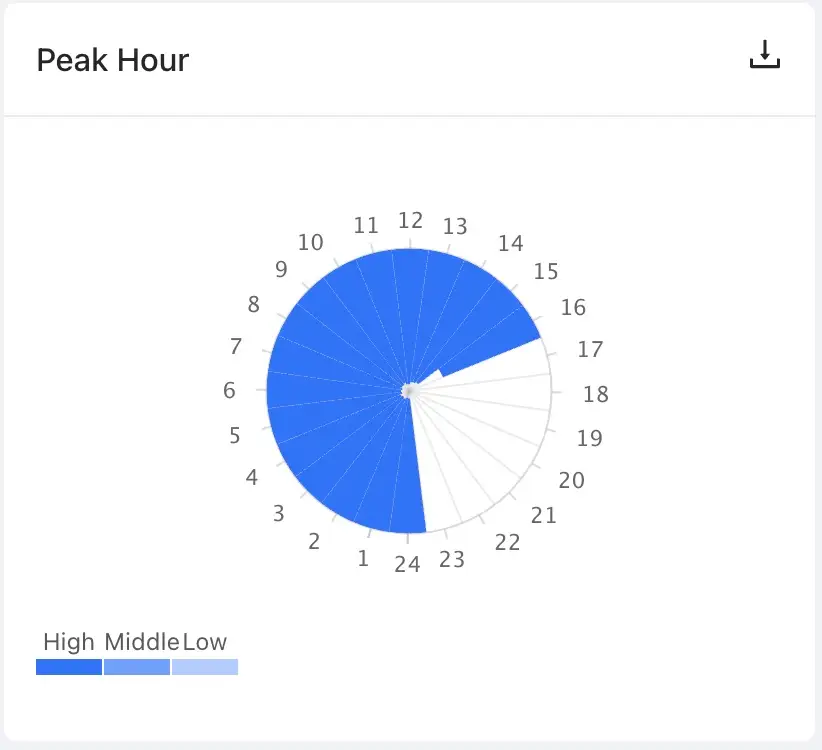
Distribution map of peak hours: display the distribution of the indicator 24 hours a day, and support multi-dimensional filtering and downloading.
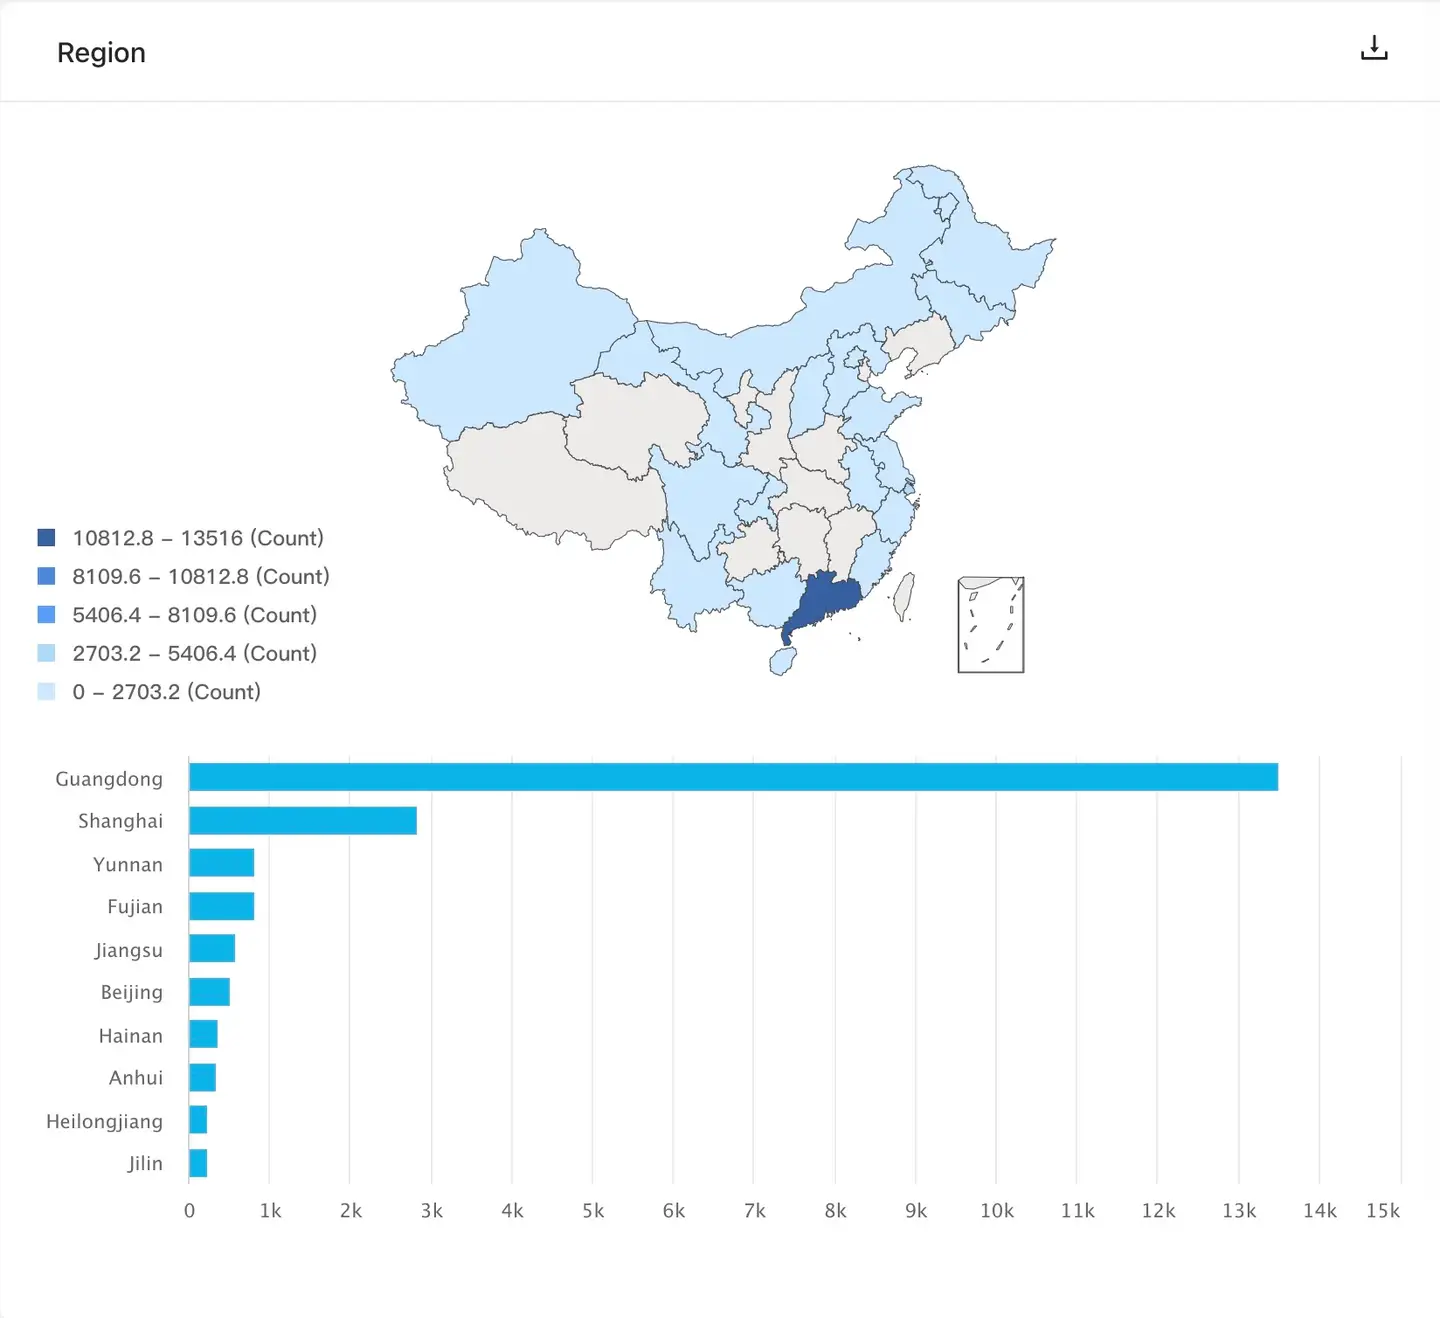
Regional Distribution Map: displays the distribution of the indicator in the regional dimension, and supports multi-dimensional filtering and downloading.
Slow interaction distribution map: display the distribution of slow interaction types, and support multi-dimensional filtering and downloading.
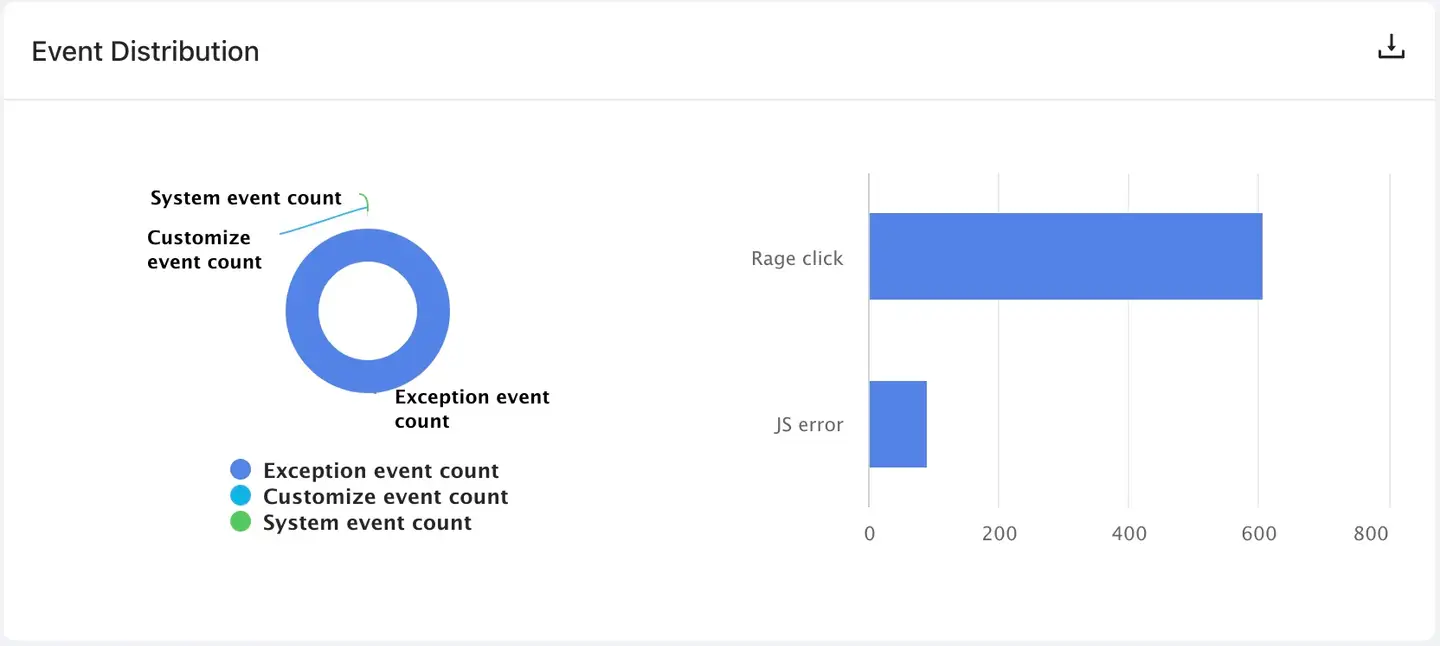
Event distribution map: display the distribution of each event, and support multi-dimensional filtering and downloading.
A list of sessions
- Filter rules
- System events: supports filtering the list based on system events, exception events, and custom events.
- Exception event: supports filtering the list according to crash, OOM, stutter, JS error, brute force click, and power consumption exception.
- Custom events: supports filtering the list based on custom events and custom errors.
- Video playback: supports filtering the list based on whether the session contains video data.
- UserID: supports querying user sessions based on UserID.
- Download rules: The platform supports downloading up to 10,000 pieces of user session data to the local (default CSV format).

Session Replay details
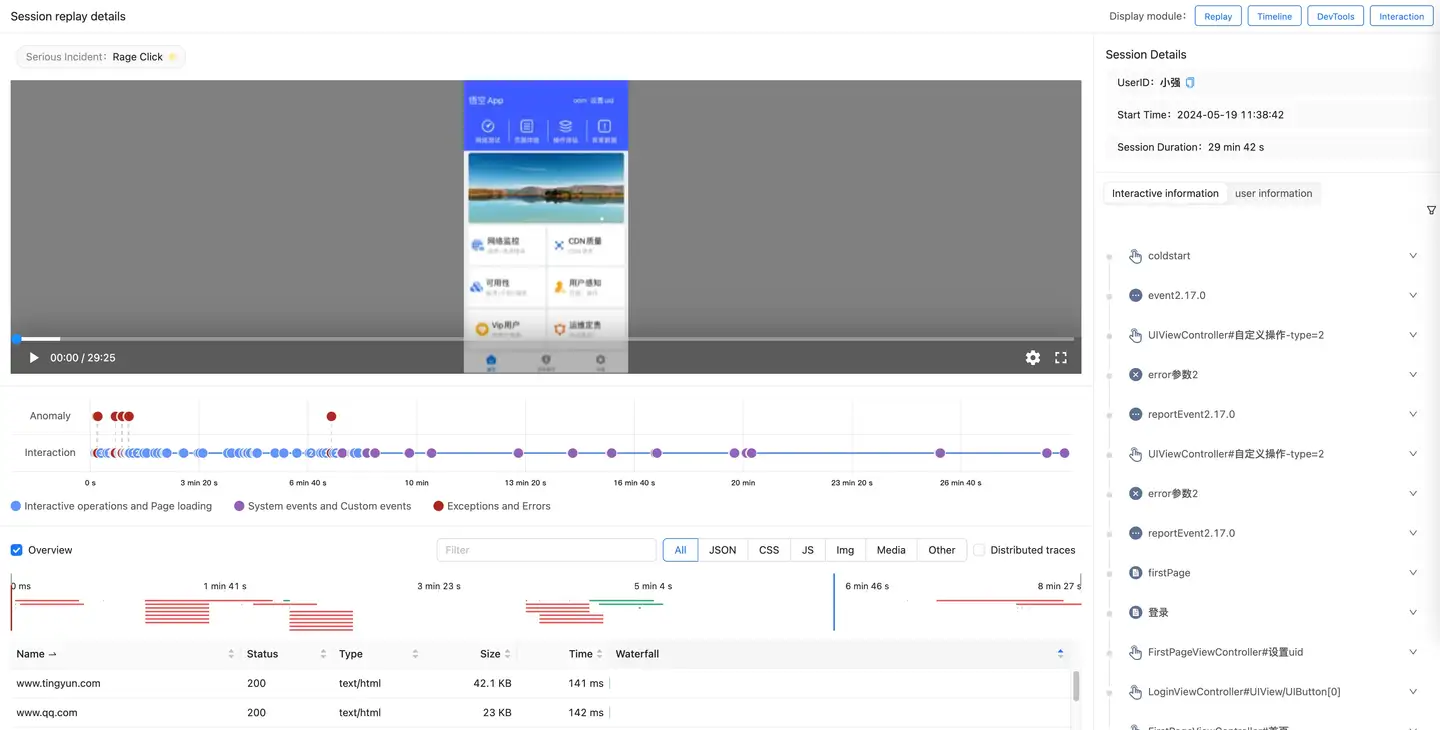
Page playback (turn on the trip backtracking switch): Display the image playback content and interactive thumbnail of the current session, which can be filtered according to the event type and support double speed playback.
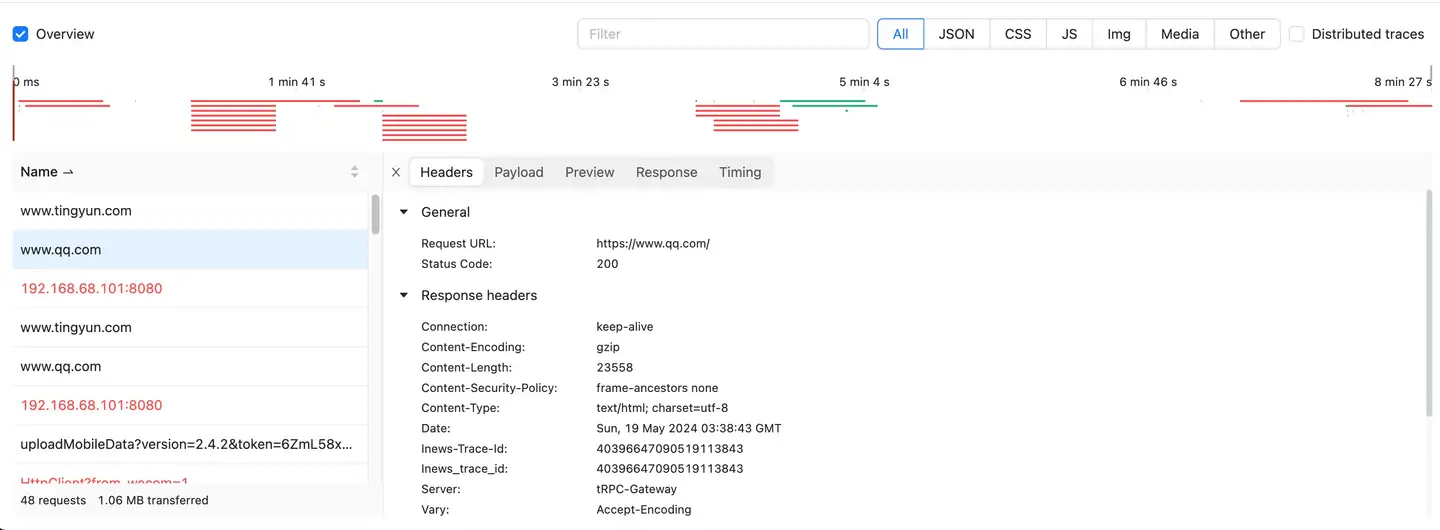
Request playback: display all network request data accessed by the user in the current session.
- Request type filtering: Supports filtering for JSON, CSS, JS, Img, Media, and Other.
- Distributed Traces: After checking, it supports filtering for full-link analysis requests. Click
the icon to view the details of the corresponding traces (supporting third-party APM platform jump).
- Request details: support the URL, Headers, PayLoad, Preview, Timing and Distributed traces of network requests
Session details: Displays the UserID, start time, and session duration of the current session.
-
Interaction information: displays all events/actions in the current session of the current user. You can view the duration of each event/action and the number of exceptions. And can be filtered based on system events, exception events, and interaction types.
-
View details: Click an event/action to view the time consumption breakdown waterfall chart of the current event/action.
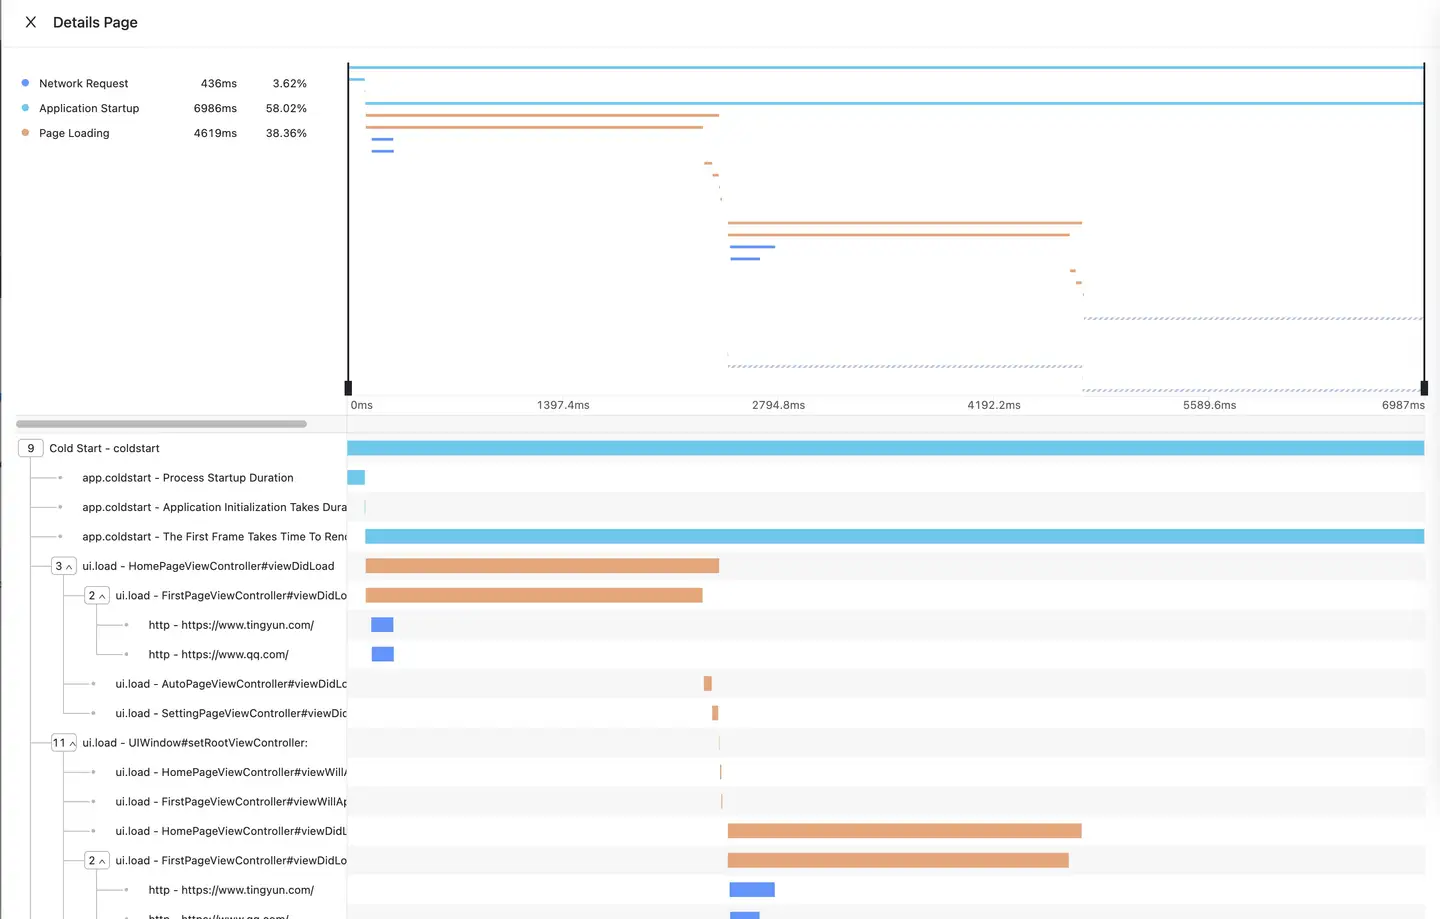
Upper left area
-
Interaction type: network request, application startup, page loading and other time-consuming parts.
-
Duration: the projection time of the current type in the session.
-
Percentage: The percentage of the projection duration of the current type in the cumulative duration of all types.
Notice: Time spans of different types can overlap, but the total duration should be based on the contribution of the exclusive time of that type (not overlapping) to the overall duration (the sum of the proportions can be greater than 100%).
The area in the upper right corner displays the thumbnail of the session. It takes time to display the entire session. You can drag the display area with the cursor to enlarge or reduce the visible range.
The lower left area shows the call tree, where you can view all application relationships in the current event/action, including lifecycle methods and network requests.
Lower right area
-
Waterfall chart: Draw a waterfall chart based on the duration of each lifecycle method and network request.
-
Missing code: When there is a gap between life cycle methods, the platform will automatically add a dotted line to indicate that the period cannot be automatically collected, which can be completed by manually calling
Custom Tracethe interface.
View Overview: Click to view the network requests triggered by this action/page on the left

User information: display the user attribute information of this session, including: application name, session type, number of abnormal events, region, operator, access mode, client public network IP address, operating system, resolution, browser and device model.
User experience portrait
Select User experience>User Journey>User Traces in turn in the navigation bar to enter the User analysis page to view the data of all user dimensions.
-
User list: with the user as the main dimension, it displays the user name, last session time and location. Support for searching on UserID.
-
User portrait: display all information of the current user, including: average session duration, session times, average interaction times, startup times, crash times, stutter times, JS error times, violent click times and custom event times.
-
The user details section records the details uploaded in the last session, including UserID, common device, operating system, application version, operator, access mode and region.
-
Session list: displays all the session data of the current user in the selected time period.
-
Problem list: show all the problems of the current user in the selected time period, including: crash, stutter, JS error and brute force click.
Client issues

List of issues: Display all front-end problems of the current user in the selected time period, including: crash, stutter, OOM, custom error, JS error and power consumption exception.
Server-side problem

List of issues: Display all the back-end problems of the current user in the selected time period, including the error type, error Message, RootCase and application returned by the back-end.