page
Performance analysis of mini-program pages is crucial because it not only significantly enhances user experience through quick response times and smooth interactions, thereby increasing user satisfaction and retention rates, but also helps developers accurately identify performance bottlenecks for effective resource optimization and reduced operational costs. Furthermore, it provides valuable data to support product iterations, enabling teams to make informed decisions and enhance the mini-program's market competitiveness. Moreover, performance analysis aids in early detection and resolution of potential issues to prevent service crashes, support marketing activities during high traffic periods, and maintain brand reputation and user trust. It is a critical component for the sustained success of mini-programs and meeting user demands effectively.
Page loading slowly
-
Load duration: The longest rendering callback time for all setData operations and requests sent after setData within the time period from onLoad to the completion of the onReady lifecycle.
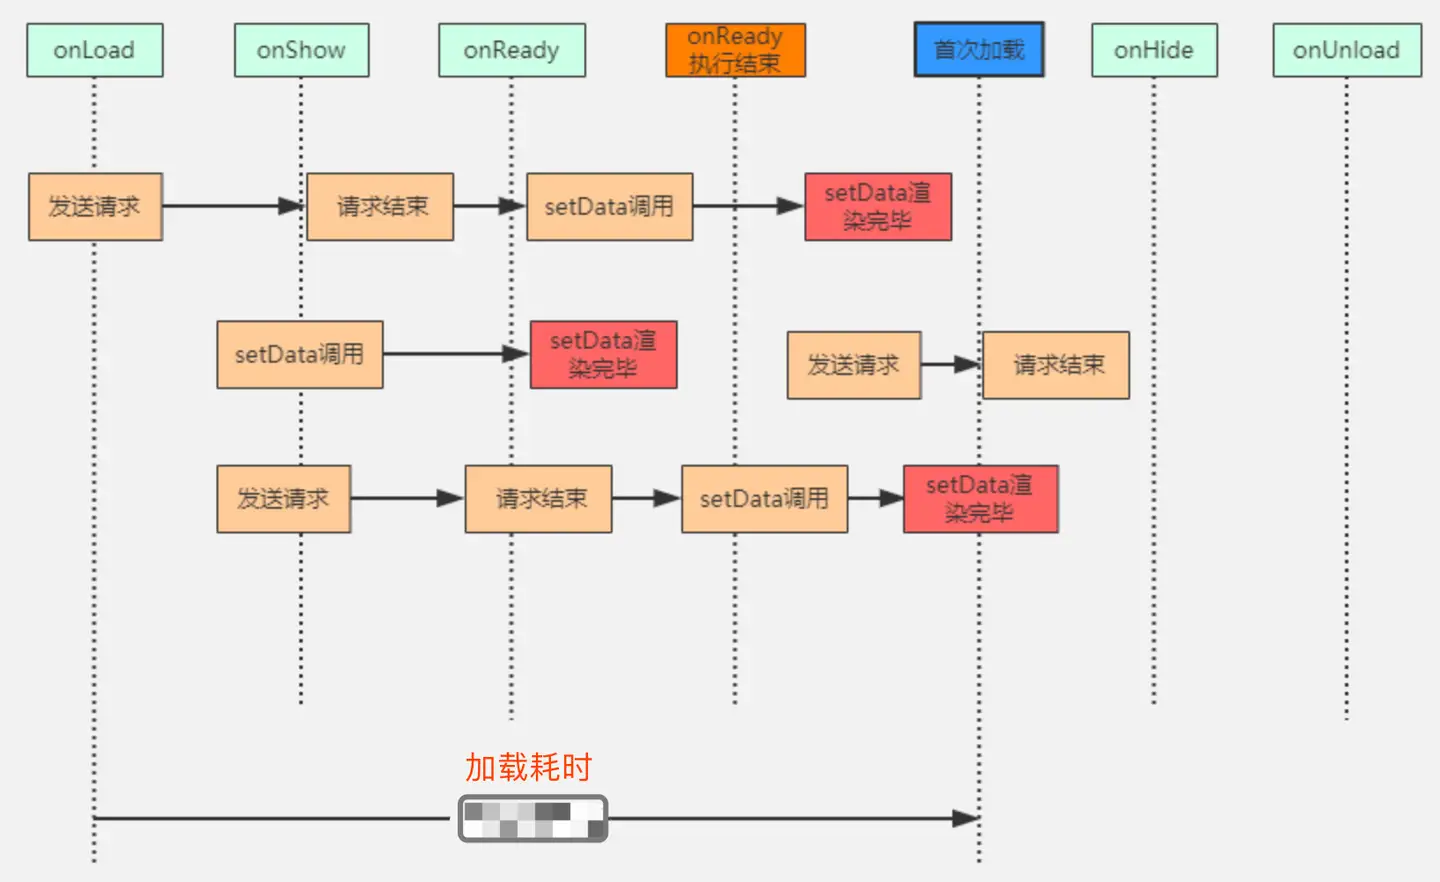
-
To pinpoint slow loading times, consider the following scenarios:
-
Large Content to Load: If loading takes long due to rendering multiple datasets, prioritize content by displaying high-priority items first to reduce load times. Use a waterfall chart to analyze the number of requests made before onReady completes and selectively reduce them.
-
Long Server Response Times: If content loads slowly due to extended server response times, investigate the reasons for the delay from the server side. Check if the server-side processing time is excessive. If the server-side time is not the issue, use network diagnostics to identify potential network-related issues.
-
Complex Rendering or Large Data Sets: When slow loading is caused by rendering excessively large data sets or computationally intensive calculations, optimize data rendering algorithms and reduce the amount of data rendered at once. Use a waterfall chart to analyze the frequency and duration of setData operations, and optimize accordingly.
These steps will help developers effectively diagnose and address the root causes of slow loading times in mini-program pages.
-
Page display errors
- Page errors primarily include network errors, timeouts, business logic errors in requests, and JS errors. These issues can be pinpointed using page anomaly tracking.
-
Page Lagging
-
Currently, the main cause of page lagging we monitor is attributed to setData operations, with the threshold based on setData duration that can be customized.
-
Factors contributing to page lag from setData: setData frequency and the size of setData payloads can both be pinpointed using a waterfall chart for page lag analysis.
-
Page List

The page list defaults to displaying page name, alias, PV, request error rate, and onReady. Additionally, you can customize the table headers by switching metrics in the top right corner. This customization includes key pages, UV, lag rate, JS error rate, slow page percentage, bounce rate, load duration, request duration, server-side duration, online time, and custom load duration.
The page list supports global filtering and page search functionalities.
Page analysis details
Clicking on the page path allows you to navigate to the page analysis details, which include page, setData, operations, requests, and JS errors. You can analyze performance issues of the page based on different dimensions.
Page
-
Metric trend chart
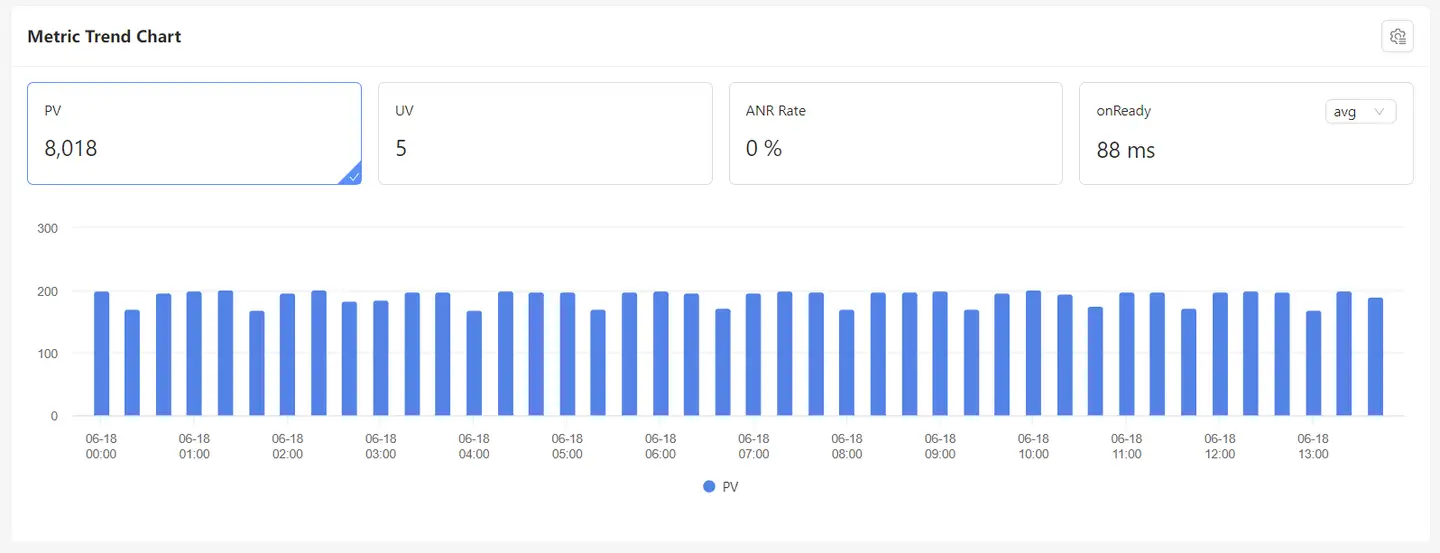
The default display includes PV, UV, lag rate, and onReady metrics. You can select other metrics by clicking on
in the top right corner, including slow page count, lagging page count, slow page percentage, bounce rate, total bounce rate, first response time, load duration, and custom load duration. Click on the metric card to view the corresponding bar chart or trend chart for that metric.
-
Region
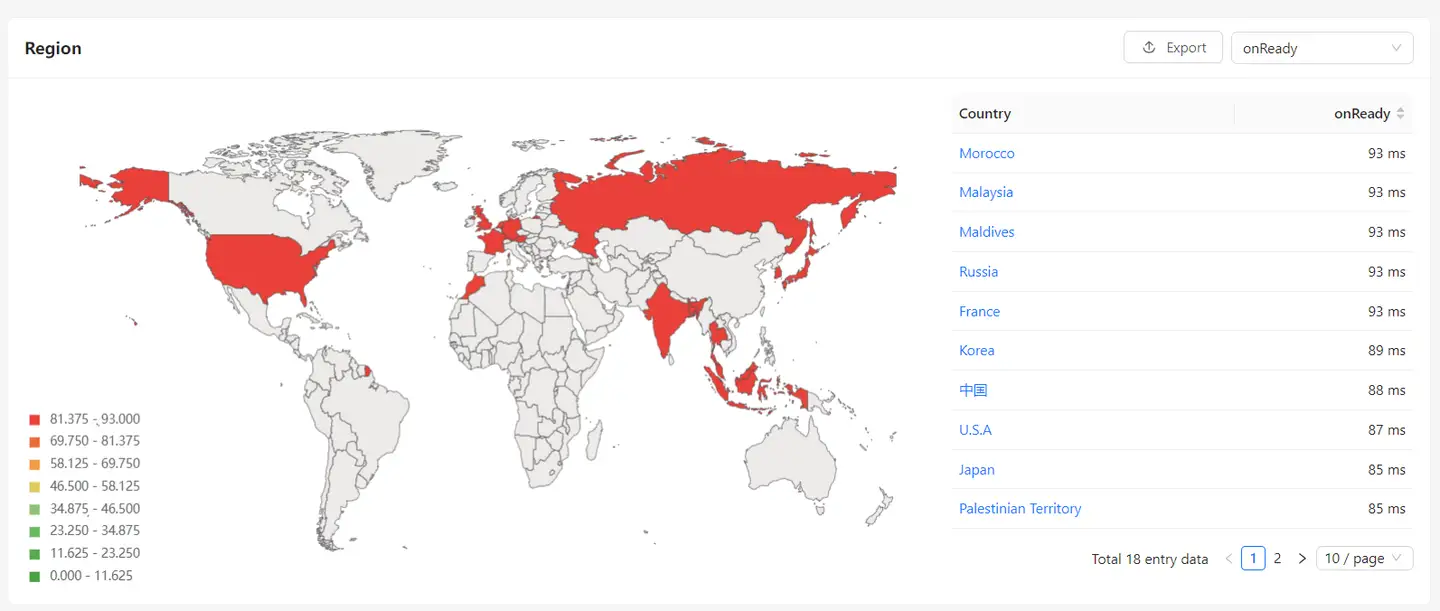
The default sorting is by onReady duration. You can also switch metrics in the top right corner to view performance metrics such as onReady, first response time, request duration, server-side duration, and load duration across different regions. Clicking on a region name allows you to add global filtering conditions and view detailed performance metrics for that region. If there are users from multiple countries accessing, it will display a world map. If users are from multiple provinces within one country, it will display a country map. If users are only from one province, it will display a provincial map.
-
Top 5 Operator Metrics Trends

The default display shows the Top 5 operators based on PV count. You can also switch metrics in the top right corner to view performance metrics such as PV, UV, JS error rate, request error rate, onReady duration, request duration, server-side duration, load duration, lag rate, and slow request percentage across different operators.
-
Time distribution
The default display shows the distribution of time spent based on onReady. You can also switch metrics in the top right corner to view the distribution across different buckets in terms of percentage and count for metrics such as onReady, request duration, server-side duration, network request frequency, load duration, and custom load duration.
-
Exception tracking
"Exception tracking" is divided into three parts: tracking for exceptional pages, requests, and JS errors.
-
Exception page tracking
Exception page tracking" allows analysis of five types of issues occurring on the current page: slow loading, network errors, JS errors, lagging, and custom load duration. It displays a list of individual samples corresponding to each issue, and clicking on the "blue" text allows you to view details of each sample.
-
Requests

Requests" can analyze two types of issues occurring on the current page: slow requests and erroneous requests. It displays a list of individual samples corresponding to each issue, and clicking on the "blue" text allows you to view details of each sample.
-
JS Error
"JS errors" can analyze JavaScript error issues occurring on the current page. It displays corresponding JavaScript error messages and error files. Clicking on the "blue" text allows you to navigate to the "JS Errors" feature module for further analysis.
-
Exception page tracking details
The details of exception page tracking include: user environment information that caused this exception, metrics information about user visits to the page, a waterfall chart of network requests on the page, and classification of network requests.
Basic information
"Basic information" can display the network or system environment of users experiencing the exception page, facilitating testing, replication, and troubleshooting.

Waterfall chart
The waterfall chart displays the start and end times of all requests made by the page, alongside the page lifecycle. It also indicates when network errors and JS errors occurred during the page's operation. Clicking on these errors allows you to track their corresponding error details.
Network Request Domain Statistics
The network request domain statistics provide information on the number of request domains and resource sizes used by the page.
User Journey
The user journey displays the complete path of how a user entered the page, navigated through it, and encountered errors during operations on a specific page.
setData
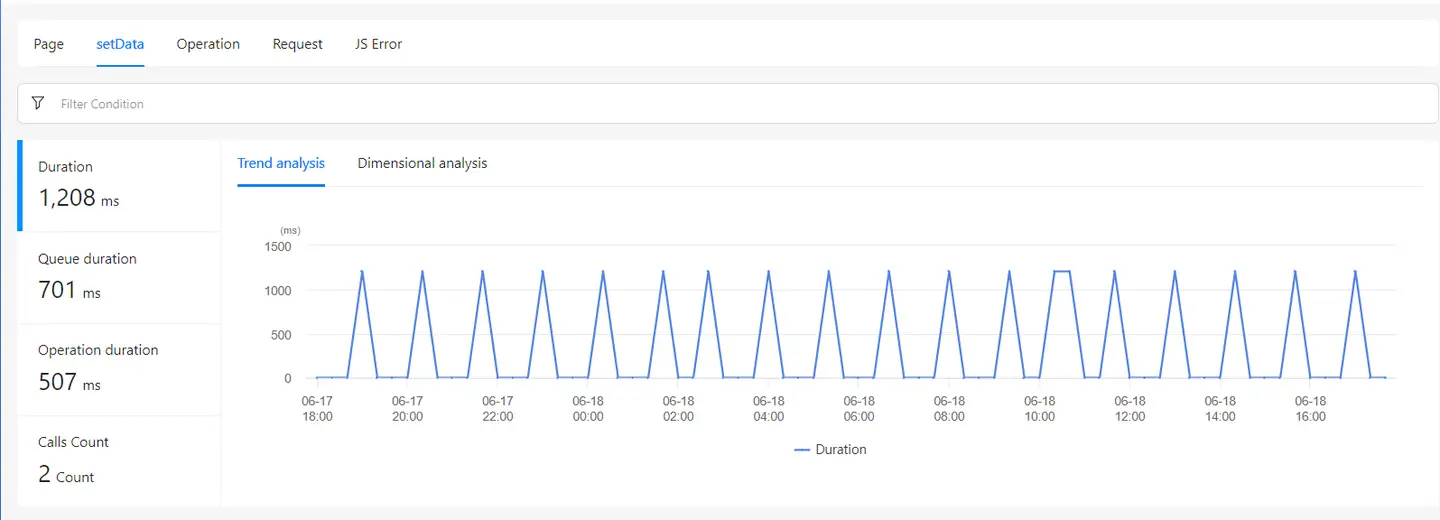
Analyzing the setData occurrences on the current page, similar to the functionalities in the "setData" module.
Operations

Analyzing the operations on the current page, similar to the functionalities in the "Operations" module.
Requests
Analyzing the requests on the current page, similar to the functionalities in the "Requests" module.
JS Error
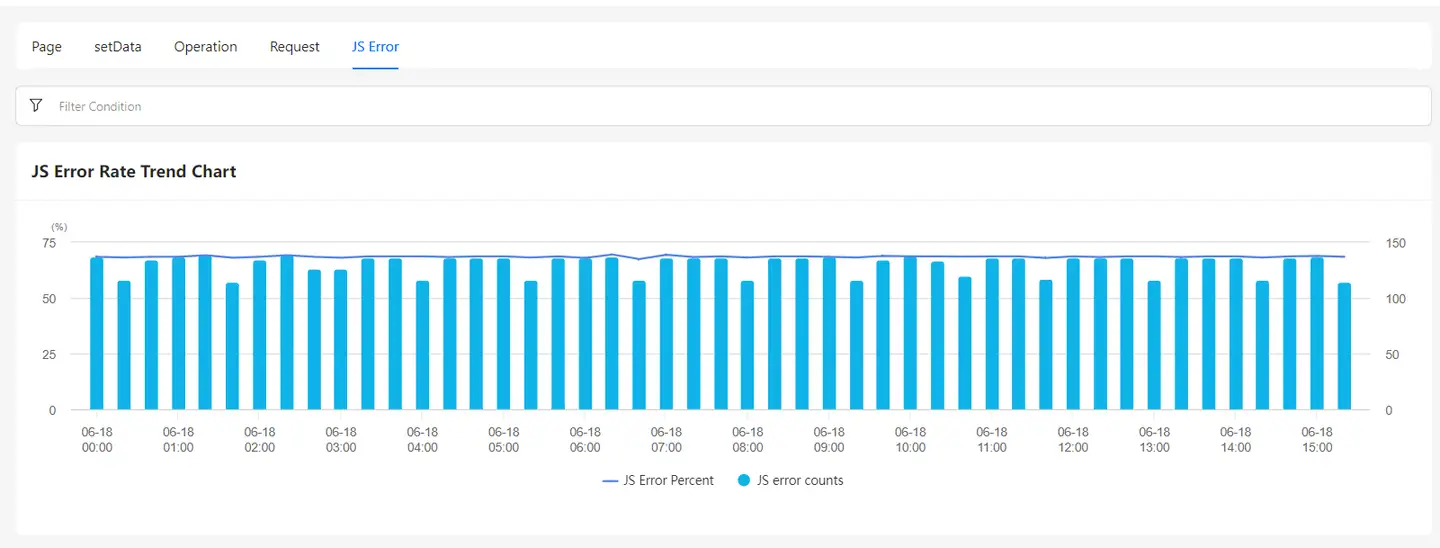
Analyzing the JavaScript errors on the current page, similar to the functionalities in the "JS Errors" module.