Path
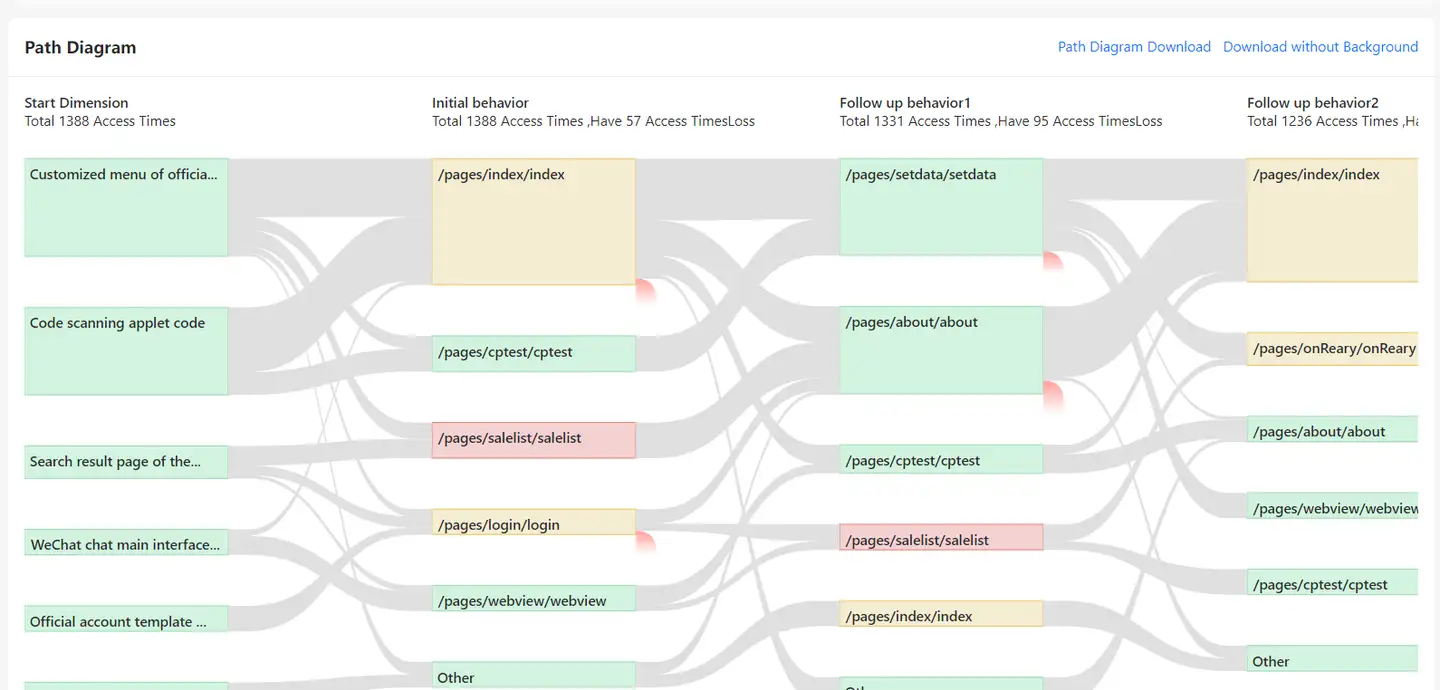
Path analysis can analyze the correlation between the user traffic flow of the mini program and the page performance. Visually display where the mini program users come from, which page they go to, which page they leave, which page they stay on, and the performance of each page. The page color is based on the performance score, and is displayed in red (performance score ≤ 60 points), yellow (60<performance score ≤ 90), and green (90<performance score ≤ 100).
Pages displayed in red and red represent poor performance scores. Click to jump to the page performance details for analysis. In addition, path analysis can be analyzed by PV or UV, and you can filter the source, network environment, WeChat version, region, operator, system, device and other filtering conditions to analyze the traffic flow and performance status under different filtering conditions.
Formulate starting channel analysis
Select the starting channel to analyze the traffic and conversion of different channels to different pages of the mini program.
- Number of visits from different channels:

- Number of visits from different channels to different path pages:
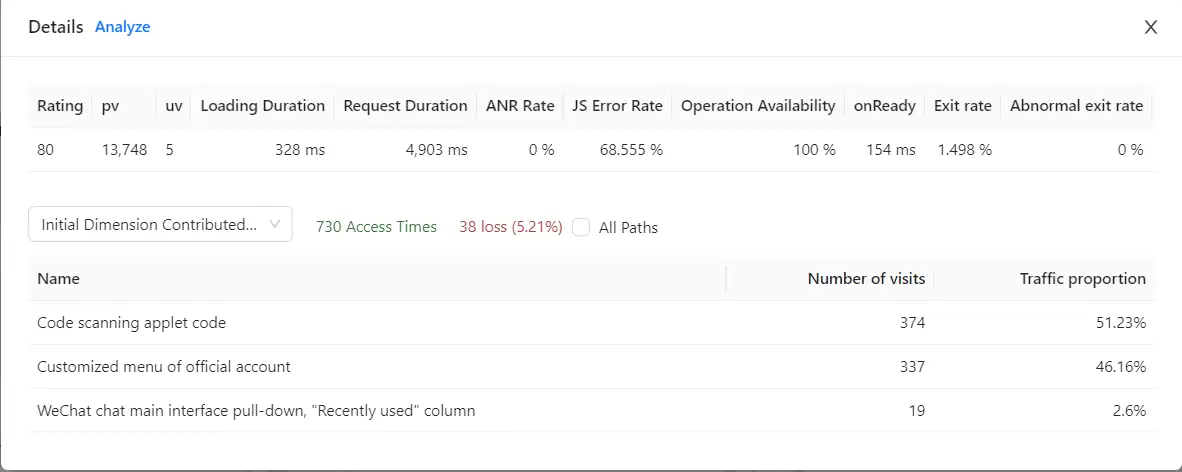
Select a page and choose View Details to see the number of visits from the initial dimension page to the path page.

Start Page Analysis
Select the start page to analyze the traffic and conversion from different start visited pages to different pages of the subsequent mini program.

End page analysis
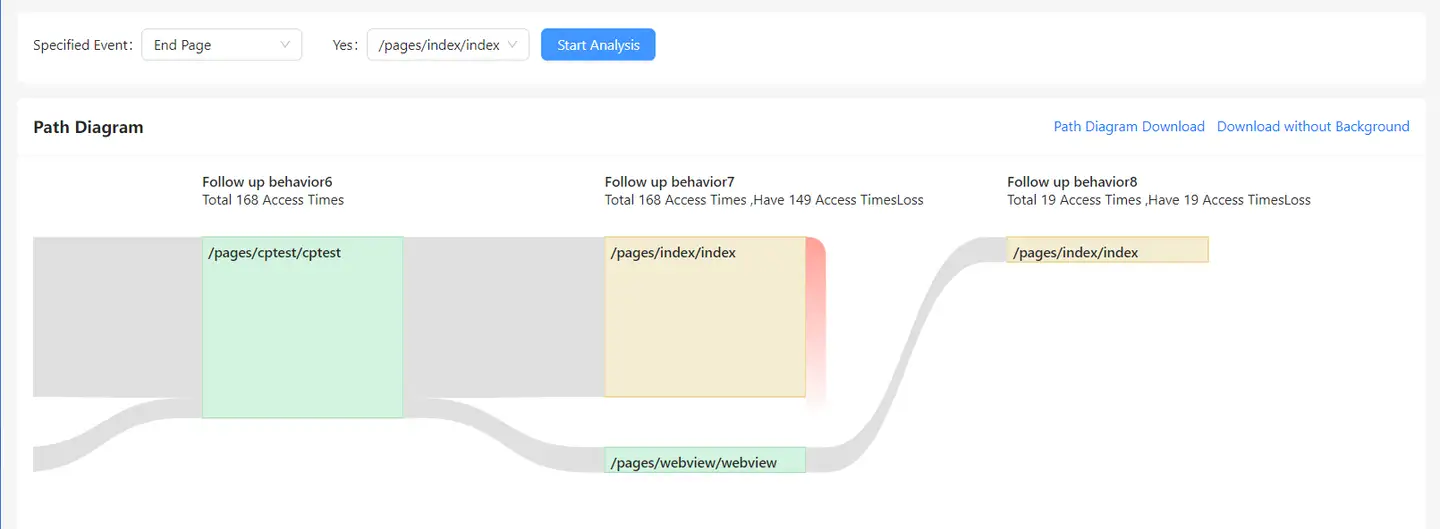
Select the specified event as End page, and then select Specific page. You can see which pages the users who lost on this page browsed before jumping out, and whether these pages have performance problems.

Critical path analysis
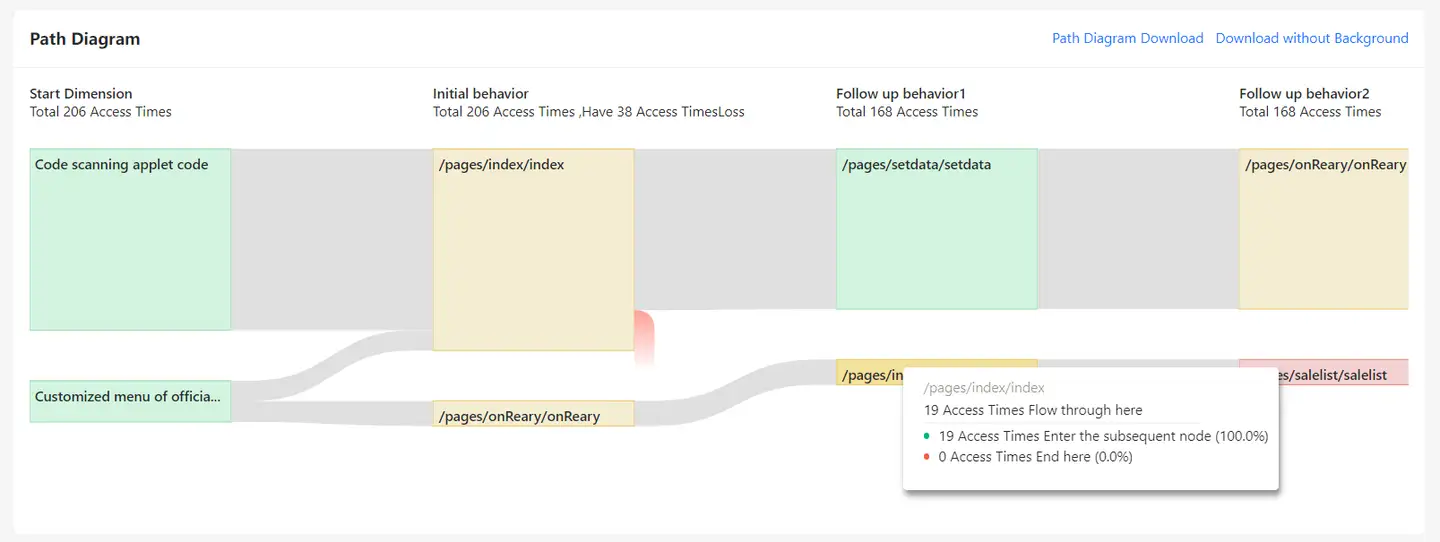
Select a specific page and select Highlight the flow through this place to highlight and analyze the path through this node.
