Request
This module analyzes the performance of all network requests of the mini program, including the time consumption ratio, number of requests, slow request ratio, response time, server time consumption, request error rate, data volume transmitted, and callback time of each request.
Network request list

The default display is the request URL, number of requests, request error rate, and request time consumption. You can view the corresponding content through the "Custom Header" in the upper right corner, including key requests, server time consumption, callback time, slow ratio, data volume transmitted, and request data availability. The list supports searching by Host and RUI.
Network request analysis details
This section analyzes the performance trend of a single network request, including performance breakdown chart, data volume transmitted, request error rate, TOP5 error types, call page statistics, and slow request list.
Network request trend chart
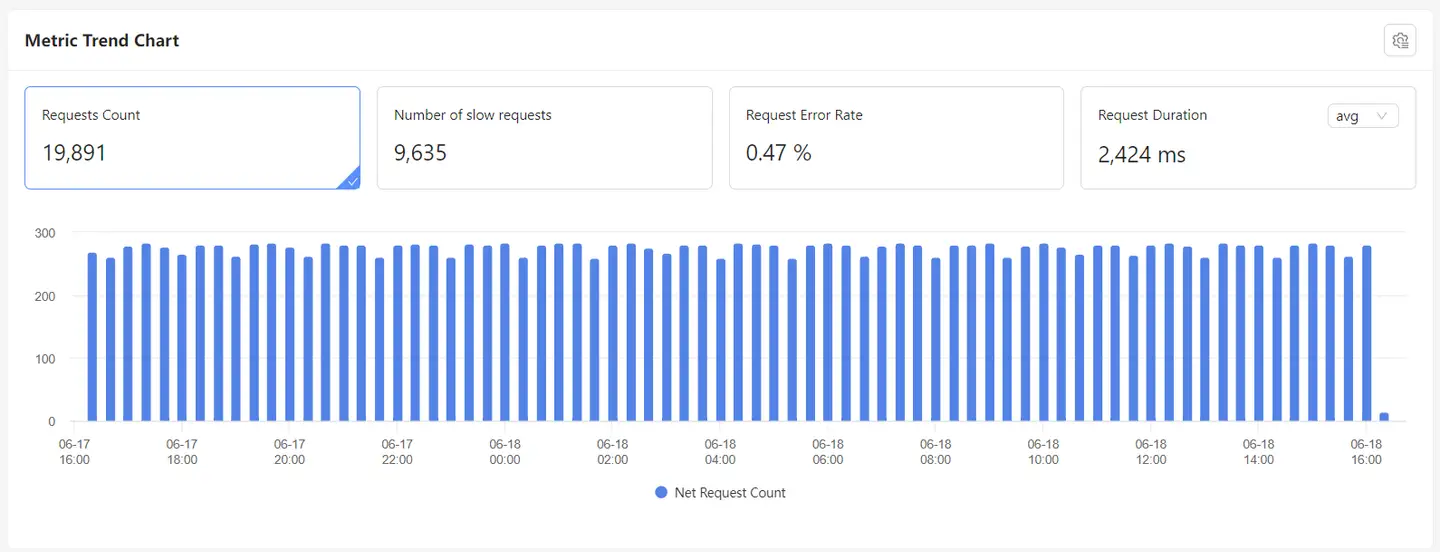
This module displays the number of requests, slow requests, request error rate and request time of the request. You can also view the trend chart and bar chart of the indicator. For some indicators, you can view the percentile data.

Dimension analysis
This module displays the error type of the network request, including https Status Code and custom data status code.

Call page statistics
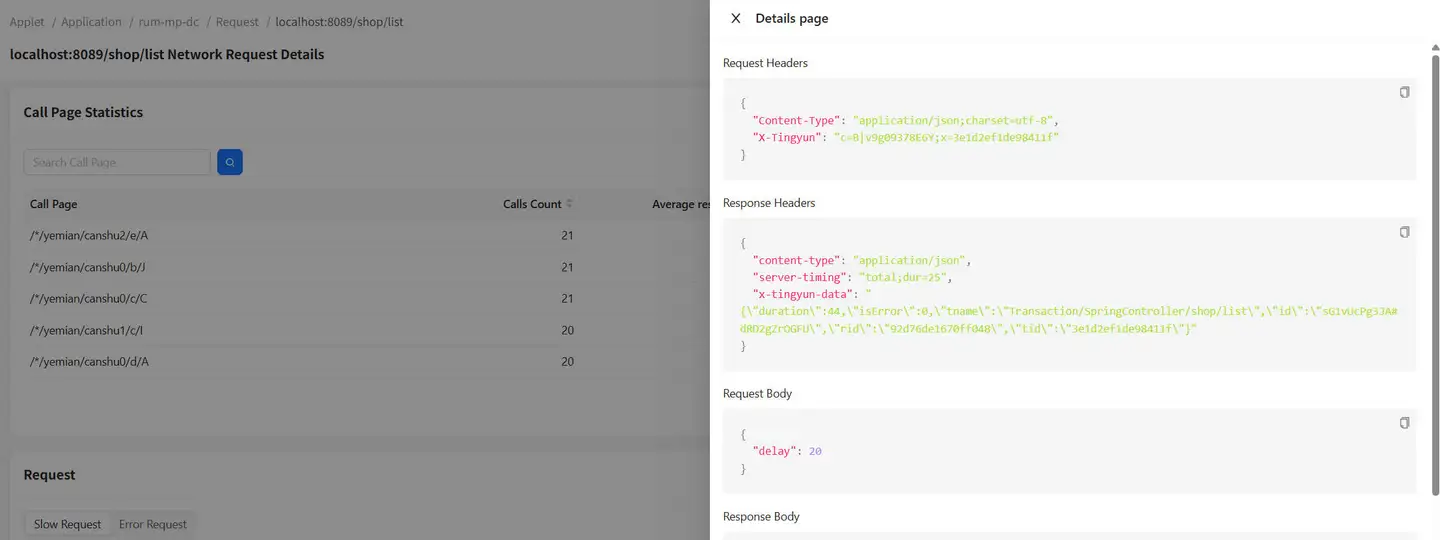
This module displays the number of times the network request is called by each page, the average response time, the transmission volume, the number of errors, the error rate, and the proportion of requests.

Request list
This module displays the sample records of slow request for the network request, including the network request URL, occurrence time, response time, server time, upload bytes, download bytes, and slow transaction tracking. If there is a slow transaction tracking, click to track the slow transaction details of the server.

Click the time field to view the detailed data of the slow request.

Error request list
This module displays the sample records of the error request corresponding to the request, including the request URL, time, status code, and error message. Click to track the error transaction details of the server.
