Request Analysis
Request analysis is mainly used to analyze the performance and errors of network requests in the application. It can analyze two types of requests: Ajax requests and static resource requests. You can analyze the request response time, proportion of slow requests, error rate, number of users affected by slow requests, and number of users affected by error requests for each application/domain name/path/parameter.
Click Web>request in the left navigation bar to access the Request Analysis page. You can quickly switch applications in the drop-down menu at the top left of the page.
Global filtering
At the top of the request analysis page, the user can globally filter the display data at the bottom according to the request type, request scope, domain name, path, parameter, page, region, operator, error code and call transaction. Click on the Expand right to display all filter criteria.
-
Request Type: displays all requested data by default. You can filter request data according to Ajax request, static resource key request, and key request.

Key requests and static resource key requests need to be configured in Apply settings, as shown in the following figure. You can configure specific requests or configure a class of requests to monitor based on wildcard rules. The configuration of static resources is applicable to the monitoring of a certain key resource, which can monitor the error rate and time consumption, such as key images such as verification codes.
-
Request range: when the request range is selected All requests Slow request, the chart at the lower part of the page displays the performance data of all requests in the application; when the request range is selected, the chart at the lower part of the page displays the performance data of requests exceeding the slow request threshold in the application. The slow request threshold can be set in Apply settings.
-
Domain name: filter domain name, support fuzzy query and multiple selection.
-
Path: filter path, support fuzzy query and multi-selection.
-
Parameter: filtering parameter; fuzzy query and multiple selection are supported.
-
Page: You can filter requests that belong to a specific page.
-
Region: filter regions, including country, province and city, and support multiple selection.
-
Operator: Filter operators, support fuzzy query and multiple selection.
-
Error code: filter error code, support fuzzy query and multiple selection.
-
Invoke transaction: The operation request time, error rate and other indicators of calling specific transaction can be analyzed through filtering and screening.
-
Ring ratio: after checking, the ring ratio information will be displayed after each column of data in the request list.

Analysis of key indicators
The five data cards respectively show the Ajax response time, the proportion of slow requests, the error rate, the number of users affected by slow requests and the number of users affected by errors in the selected time period, as well as the value and growth rate of the previous cycle. The previous period represents the ring ratio, for example, the selected time period is today, and the previous period is yesterday, which can be used to analyze the changes of indicators after system changes. Click the data card, and the analysis data of the corresponding indicator will be displayed in the dimension analysis part below and the trend chart on the right.
The key indicators are as follows:
- Response time refers to the time from the sending of Ajax to the return of the server and the receipt of the returned results, which is a key indicator to measure the quality of Ajax performance.
- The proportion of slow requests refers to the proportion of requests that exceed the slow request threshold.
- The Ajax error rate is the proportion of the number of requests with a request status code of 400 or more.
- The number of users affected by slow requests is the number of users that trigger slow requests, which measures the range of users affected by slow requests.
- The number of users affected by the error is the number of users who triggered the request error, which measures the range of users affected by the request error.
The operating instructions are as follows:
-
Response time analysis supports quantile switching.
-
Click the drop-down menu at the top right of the dimension analysis chart to switch the analysis dimensions: region, TOP operator, TOP5 error code, TOP5 page, and TOP5 calling transaction.
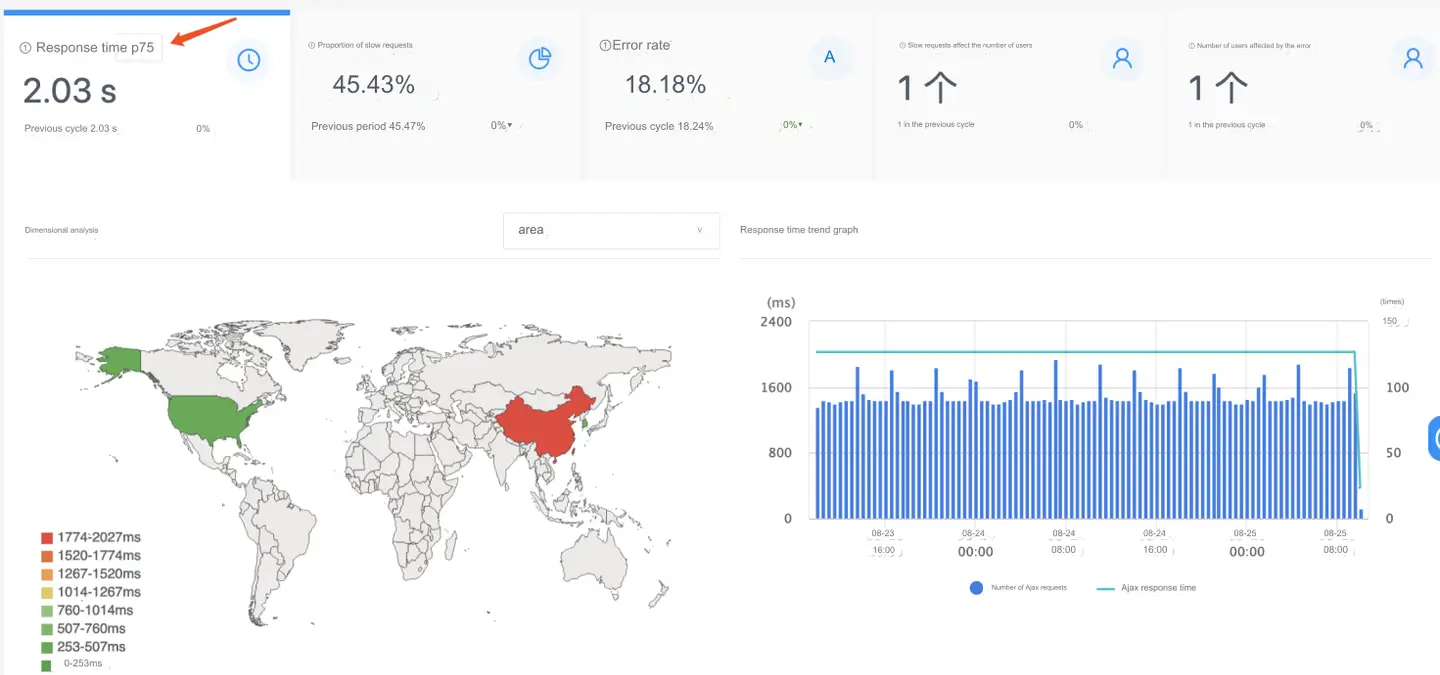
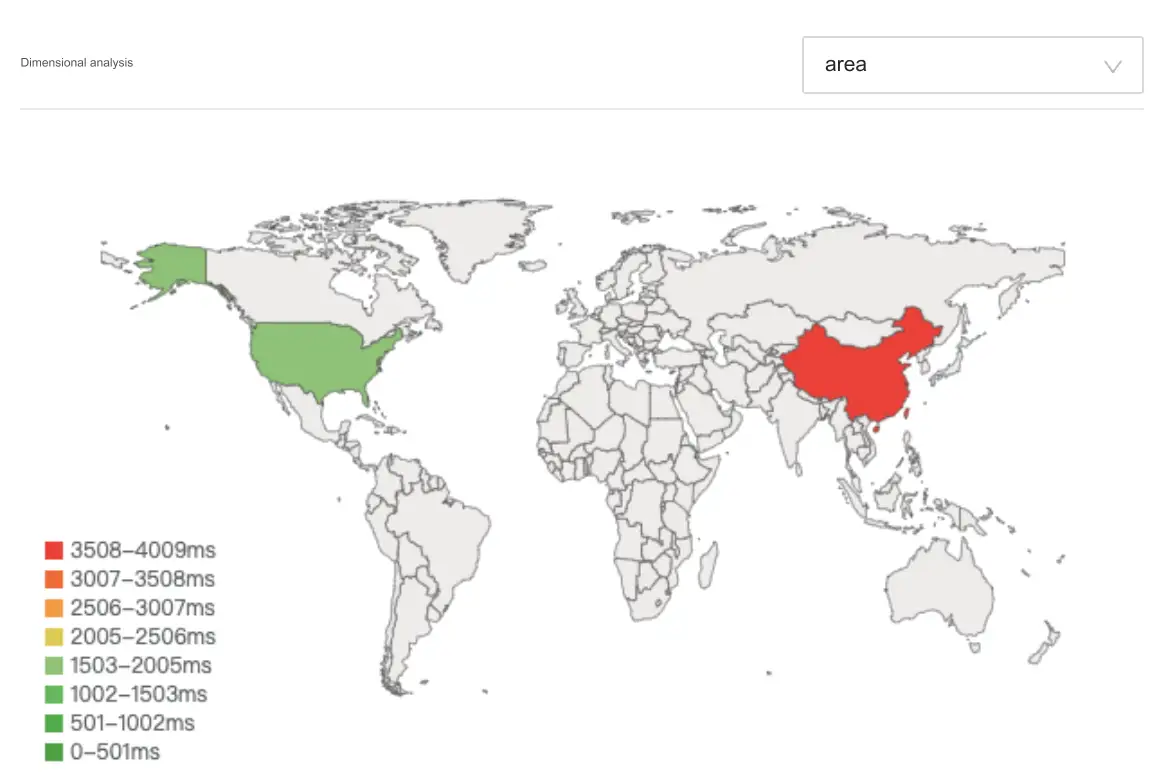
Geographical dimension
Display performance indicators from different geographical dimensions. The indicator range and color can be customized in the basic settings of the application. When you click a zone, you can add the current zone condition to the global filter.
TOP5 operator
Performance metrics are presented from different operator dimensions. The response time and the number of requests of the five operators with the highest number of requests are displayed, and the response time is sorted from high to low. Click to add the condition to the global filter.
TOP5 error code
Performance metrics are presented from different error code dimensions. Display the response time and request times of the five error codes with the most requests, and sort them according to the response time from high to low. Click to add the condition to the global filter.
Page to which TOP5 belongs
Display performance indicators from different page dimensions. Display the response time and the number of requests of the five pages with the highest number of requests, and sort them according to the response time from high to low. Click to add the condition to the global filter.
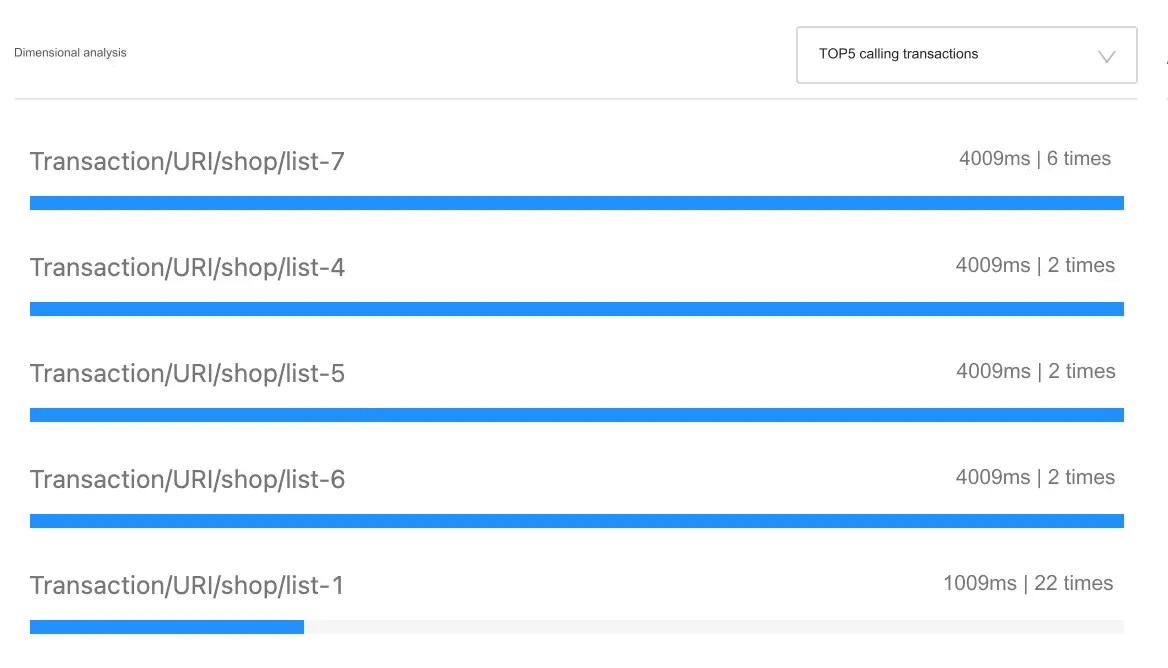
TOP5 calls the transaction
Expose performance metrics from different call transaction dimensions. Shows the transaction response time and the number of requests for the five most requested calls, sorted from highest to lowest response time. Click to add the condition to the global filter.
Request list
The request list includes request URL, alias, number of requests, number of users, response time, error rate, ratio of slow requests, ratio of slow requests, ratio of error times, slow transaction ratio, slow network ratio, server time, amount of data transmitted, callback time, network time, number of users affected by errors, and number of users affected by slow requests. These indicators can be focused on by clicking the icon in the upper right corner .
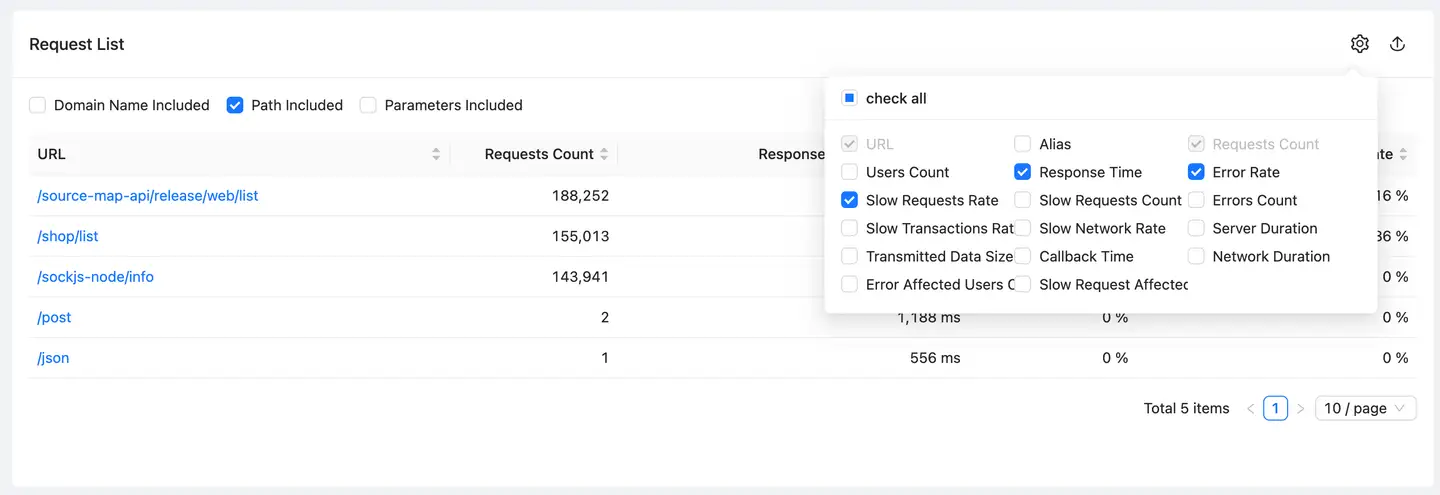
-
For the URL displayed in the list, you can adjust the URL display rules by checking Contains the domain name the, Contains the path and Contains parameters check boxes. For example, if you only check Contains the domain name, the Ajax request will be analyzed according to the domain name dimension; if you only check Contains the path, the request will be analyzed according to the path.
-
Click URL to add the URL to the global filter, showing the performance of this URL, including key indicators, TOP dimension and slow request list.
-
Click the download icon in the upper right corner of the list to export the list data to the local in Excel.
User tracking
User tracking can retrieve slow requests and error records for their access based on user ID, public IP, session ID, device ID, request URL.
The user tracking list includes such indicators as request time, URL, user ID, error code, time consumption, TraceID, session ID, public network IP, device ID, server time consumption, network time consumption, data size, region, operator, call page, APMTraceID, status code, call transaction, metadata, etc. The header can be customized. Click the download icon in the upper right corner of the list to export the list data to the local in Excel.

Cross-application tracking
Backend transaction details can be traced by clicking on the server side of each request.

Request data details
Click Time to view the request data details, including Query Params, Request Body, Request Headers, Respone Body and Respone Headers. This part of data needs to configure the probe separately. For the configuration method, see [Configure request tracking](#Configure request tracking).
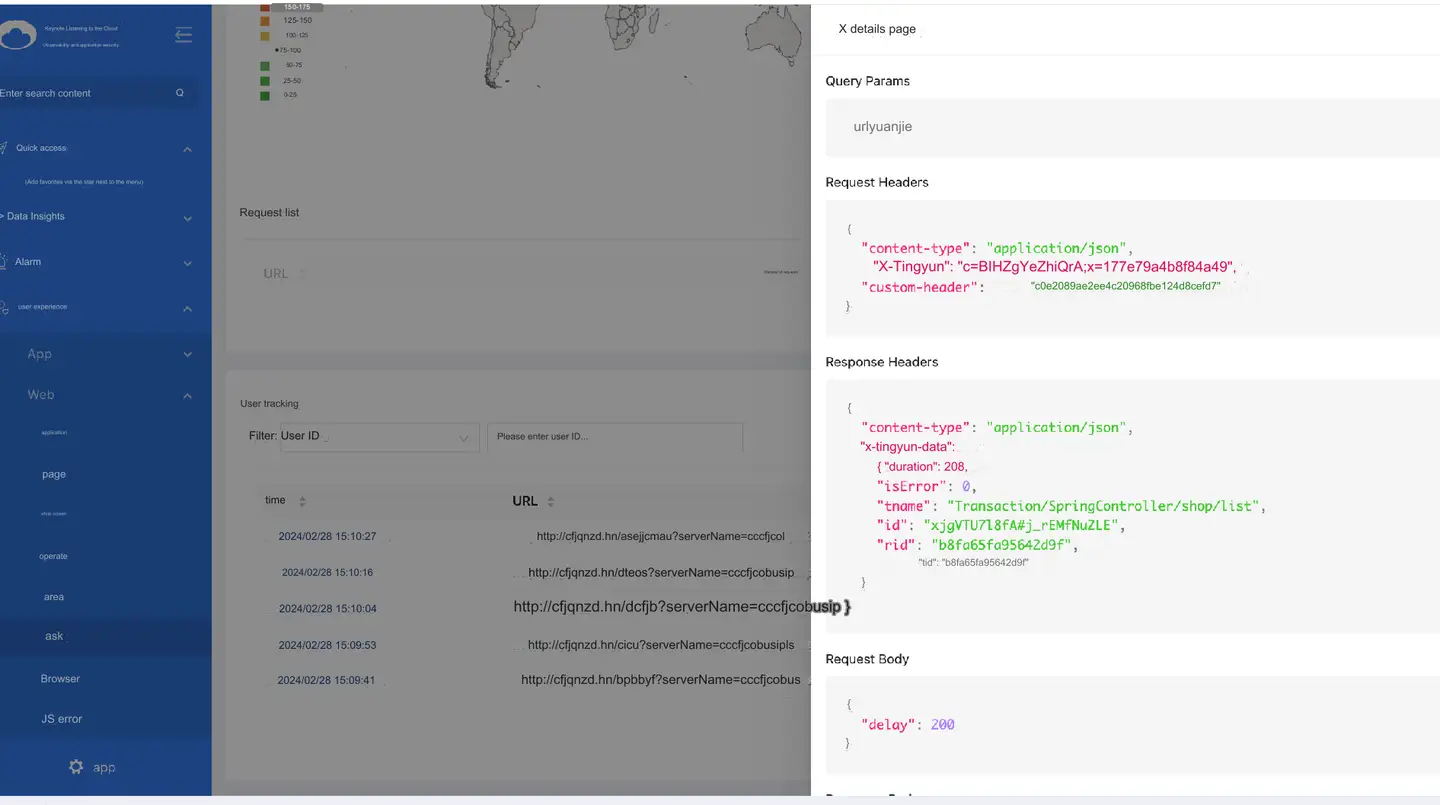
APMTraceID
APMTraceID is a third-party APM to associate the front-end request with the back-end transaction. It needs to be configured separately. Please refer to Application Settings-APM Settings.
Metadata
Metadata supports Ajax to request global or single custom information content to upload to the platform, and supports viewing and analysis. See Custom attached attributes for how to set it.
Configure request tracking
-
Click Web>Overview in the left navigation bar to enter the List of applications page. Click in the Set up Target Application Set up column to enter the Basic settings Single Application page.
-
Click Download JS the Get the probe button at to download the probe.
-
Search for
window.TINGYUN&& window.TINGYUN.initthe keyword in the downloaded probe, findty_rum.server={the keyword in the back, add or modifycollect_all_paramthety_rum.server={configuration item in, and use 5 character strings to represent respectively: URL, request header, request body, return header and return body. 1 represents acquisition, and 0 represents no acquisition. Without this field, it is regarded as no acquisition. For example, get all 1111 1. As shown in the figure: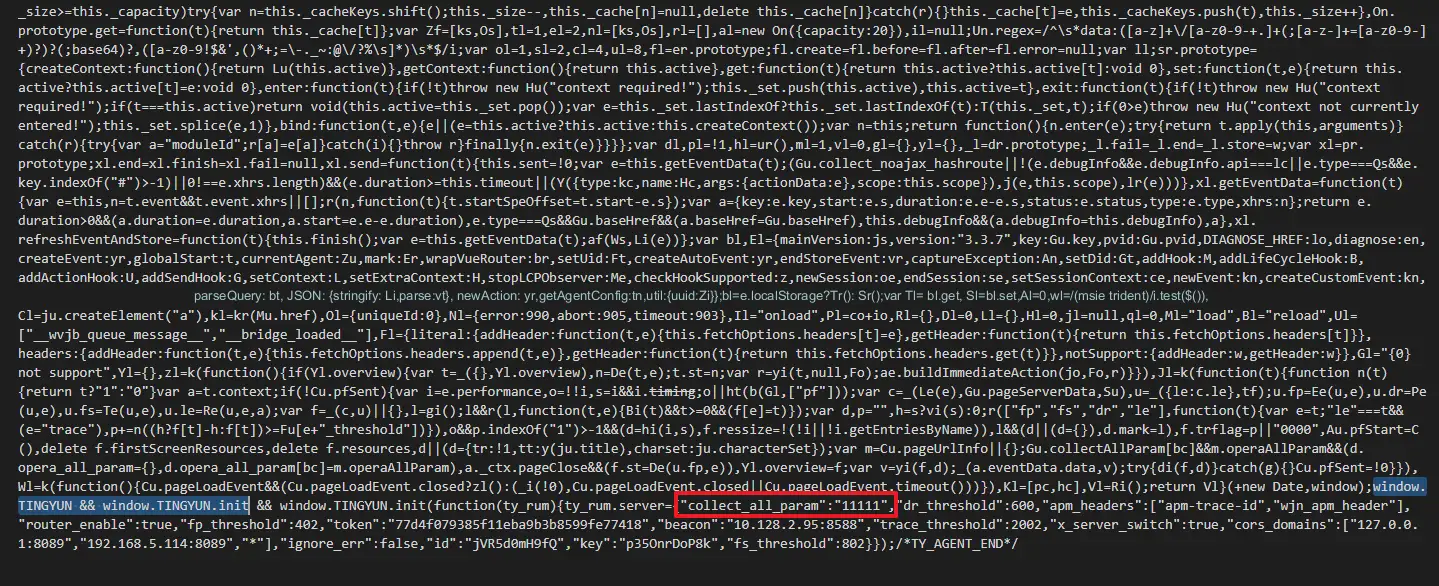
-
Re-embed the code.
-
After uploading the performance data using the recode page, go to Ajax>User tracking and click on the URL to see the Ajax request.