JS Error Analysis
JS error analysis is mainly used to analyze the JS errors that occur when a page is accessed, and to count and analyze the causes of JS errors.
Click Web>JS Error in the left navigation bar to enter the JS error analysis page.
-
Check Show ignored JS errors the box in the upper left corner of the page, and the data in other charts and JS error lists will be recalculated and displayed, except that the trend chart of JS error rate will not change ( JS error rate is calculated based on the data after ignored JS errors). Unchecked by default.
-
Check JS error the box in the upper left corner of the page to see only the statistics for JS errors. Checked by default.
-
Check Custom error the box in the upper left corner of the page to view only the statistics for custom errors. Checked by default.

List of JS errors
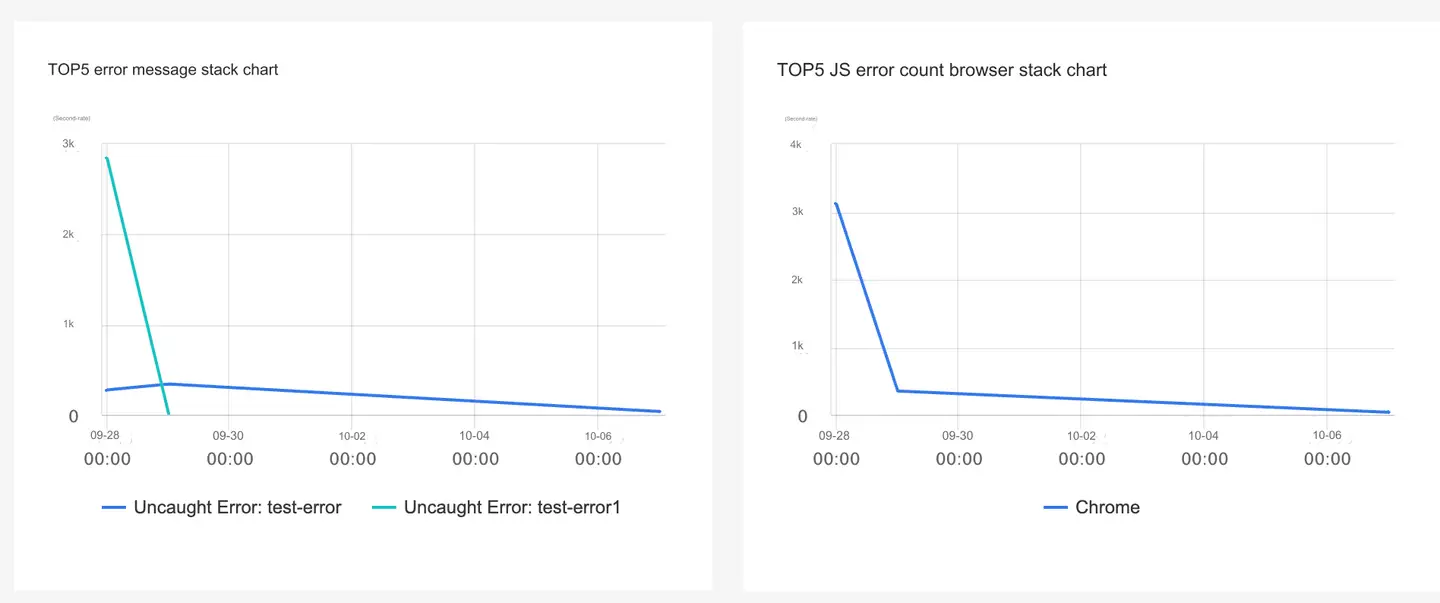
JS error list can be analyzed according to two dimensions of JS file and JS error information, respectively displaying the proportion of errors, the number of errors and the number of affected users analyzed according to the JS file name and the proportion of errors, the number of errors and the numbers of affected users analyzed according to the error information.
When selected Analyze by JS error message, the user can click Handler the drop-down menu of the column to assign the handler and click the drop-down menu of the Status column to set the error handling status. Users can filter JS errors according to the handler, processing status, and error information.

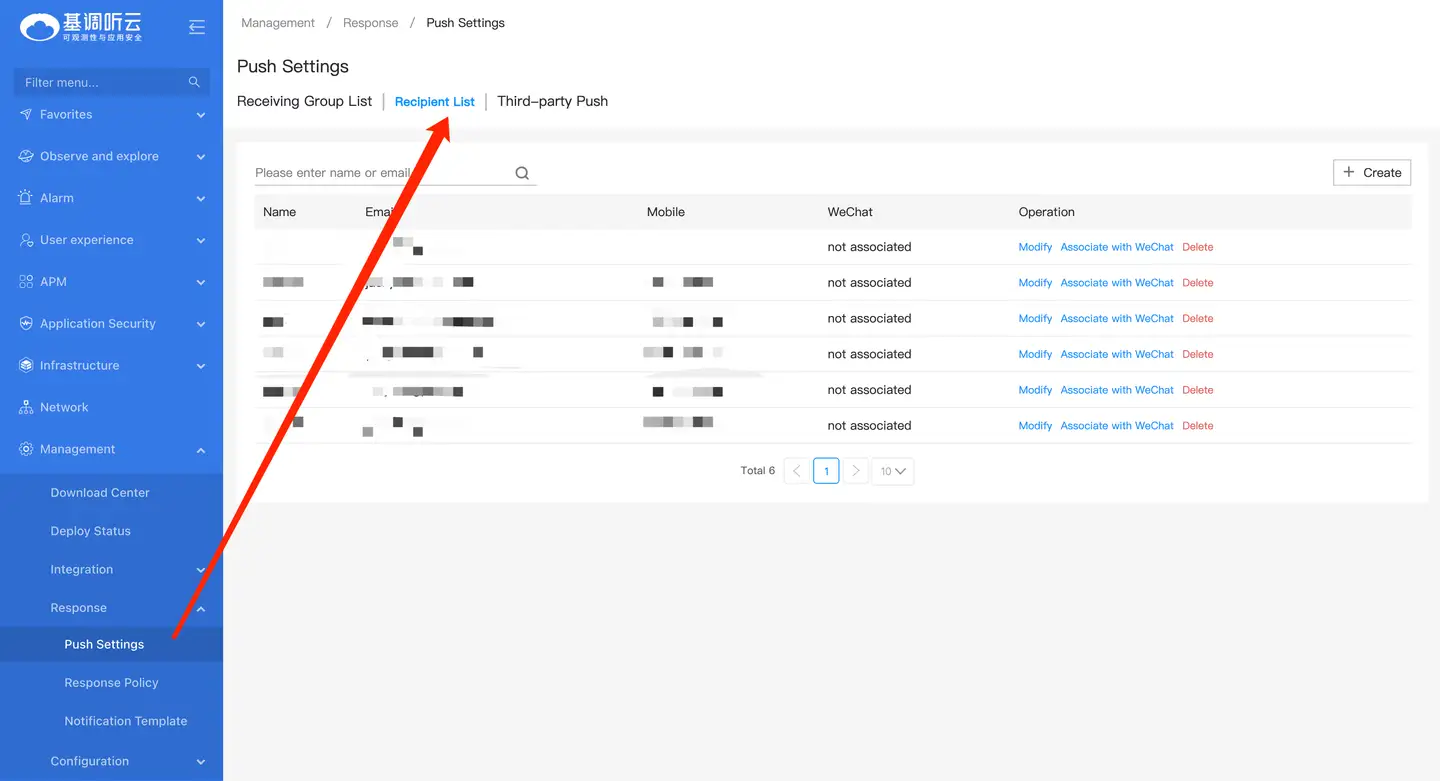
The user can enter Configuration the > Respond > Push configuration > Recipient list page to configure the handler.

JS Error Tracking Record
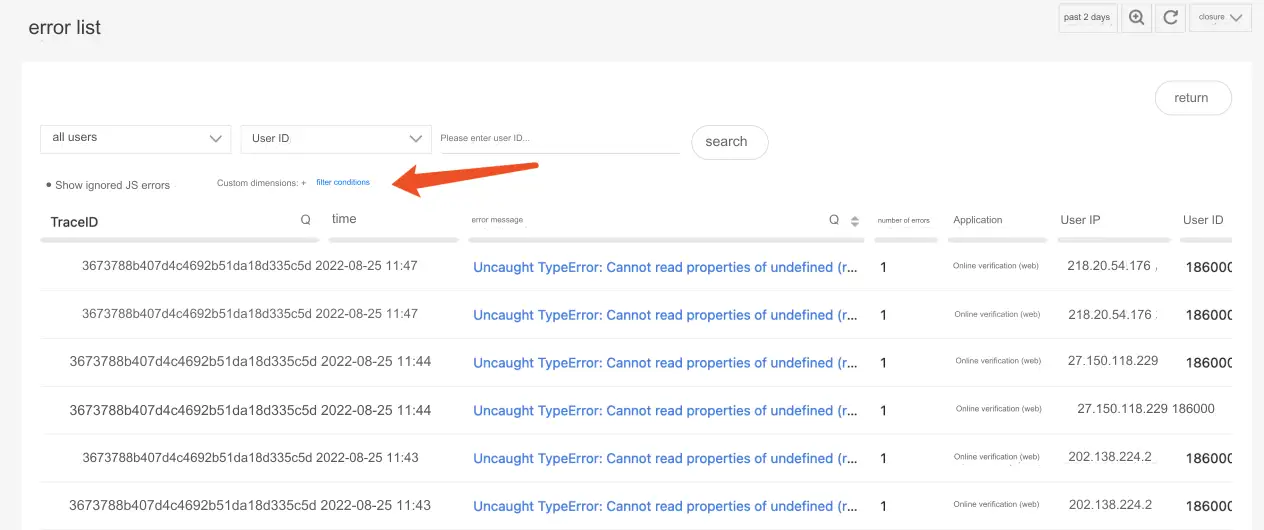
Click the JS file name or error message to view the detailed error record.
Click after Filter conditions the user-defined dimension to filter according to the user-defined dimension. For custom dimension configuration, you need to upload custom information first (see Custom Attached Properties), and then configure custom dimension fields in App Settings>Custom Dimensions>Common Configuration.

JS error details
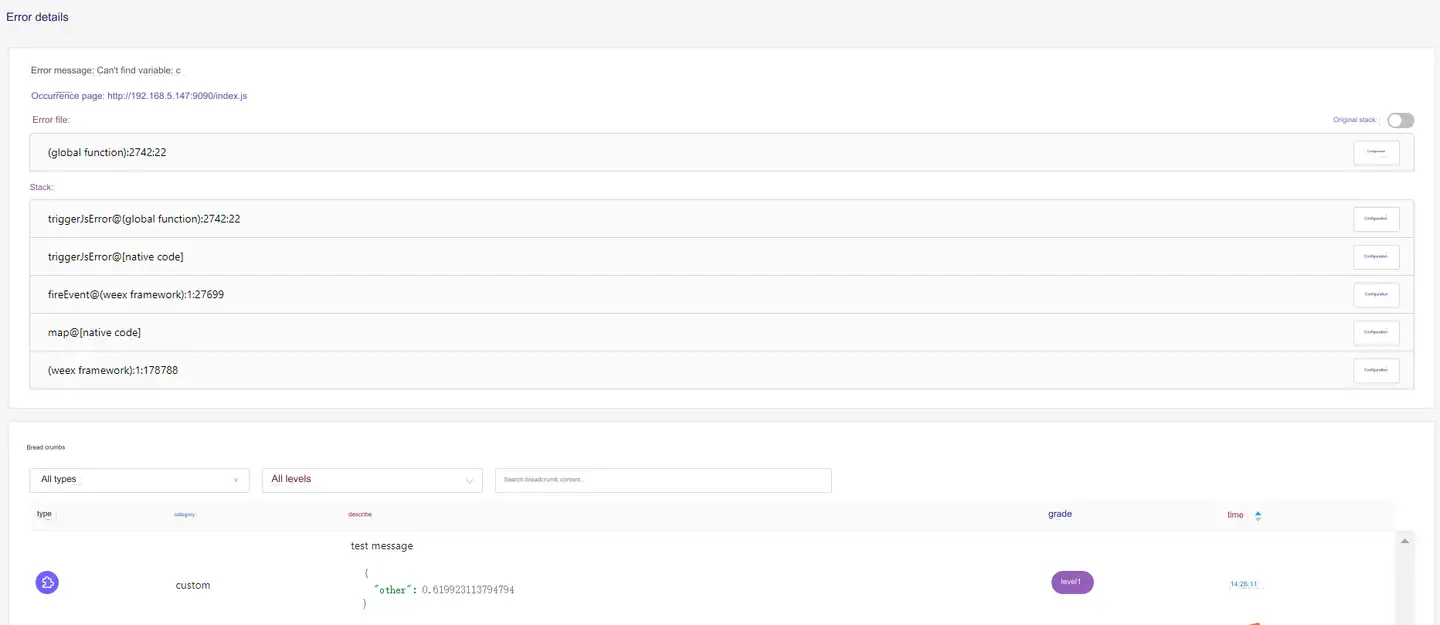
Click an error record to enter the Error details page. JS error details include JS error file name, URL of the page where JS error occurs, error file, stack, UserID, IP address, SessionID, device ID, browser, operating system, region, operator, application version, SDK version, UA (User-Agent), and metadata information of JS error.
Click the button after Configuration the error file to configure the Source Map for all stacks in the JS file. By clicking the button after Configuration each line of stack, the user can configure Source Map separately for the specified stack. Source Map is an information file that stores the mapping of the corresponding position of the source code and the compiled code, which can help to restore and locate the compressed JS code error column. For the configuration method, see Source Map.

-
Please refer to Escalate JS errors and add breadcrumbs the breadcrumb configuration method.
-
Please refer to custom attached attributes the metadata configuration method.