Browser Analysis
The browser module can help to analyze the UV ratio, PV ratio, full loading, slow page ratio and JS error rate of different browsers accessing the application, help to determine which browsers have more problems with the program, formulate test priorities and focus on optimization .
Click Web>Browser in the left navigation bar to enter the browser analysis page.
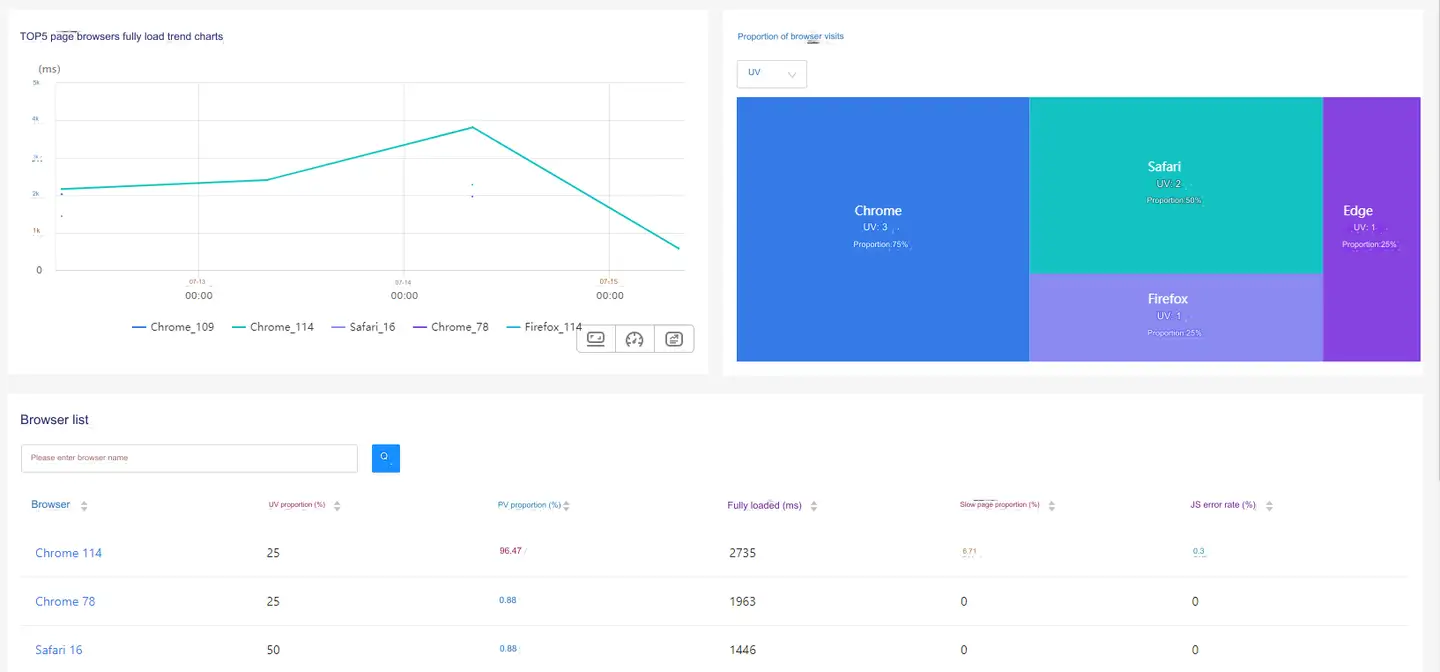
- TOP 5 Page Browser Full Load Trend Chart Shows the full load time trends of the top 5 browsers, down to the browser version number.
- Proportion of browser visits Display the UV and UV ratio, PV and PV ratio of each browser access application. PV and UV can be switched in the drop-down menu in the upper left corner.
- List of browsers Show the UV ratio, PV ratio, full load, slow page ratio and JS error rate of each browser access application.

Click the browser name to view the browser analysis details. Click the button in the upper right corner Return of the details page to return to the browser analysis page.
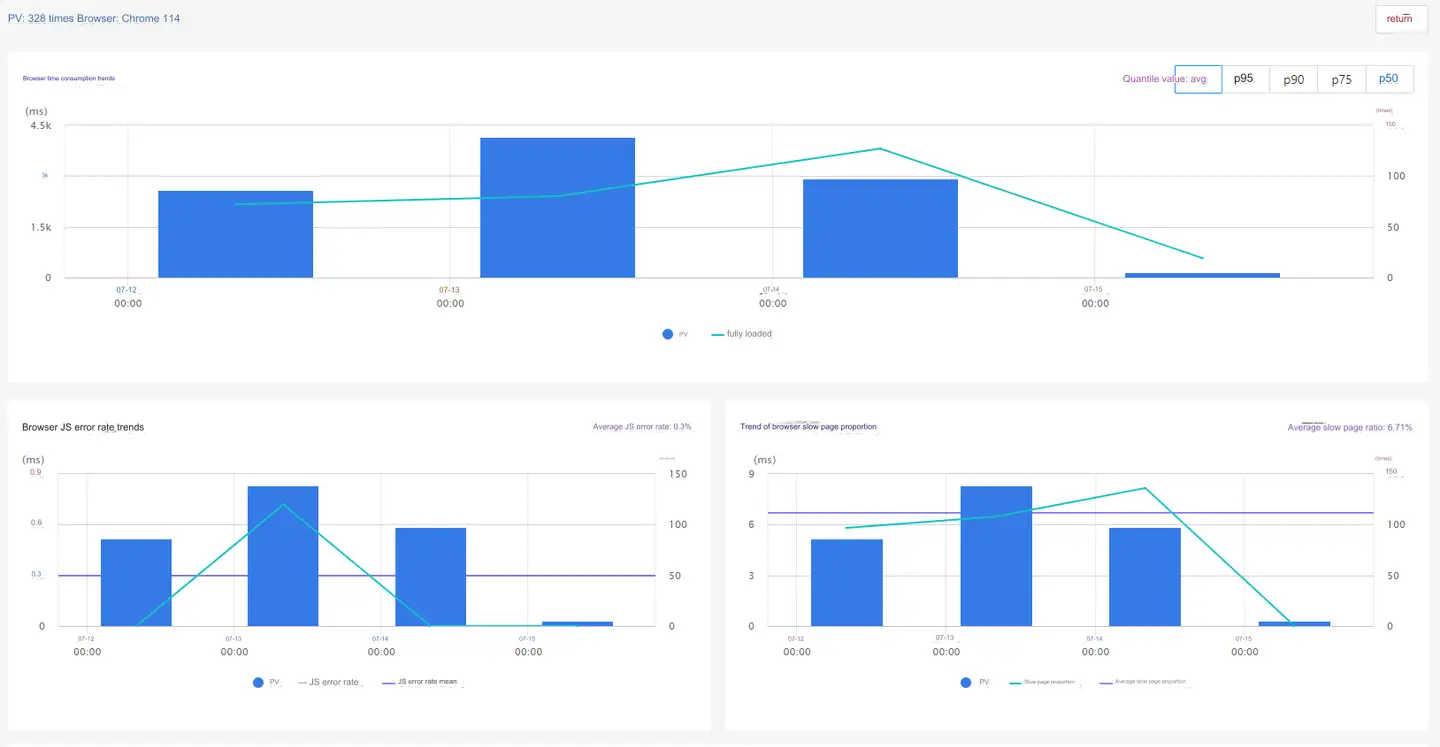
- The upper left corner shows the total number of PV visits to the page through the browser in the selected statistical period, the type and version of the browser.
- Browser time consuming trend Show the change trend of PV and full load time of current browser access application. You can toggle between quantile values in the upper right corner of the chart. Average, 95th, 90th, 75th and 50th values are supported. Average is shown by default.
- Browser JS Error Rate Trend Show the change trend of PV, JS error rate and average value of JS error rate of current browser access application.
- Browser Slow Page Percentage Trend Show the change trend of PV, slow page ratio and average slow page ratio of the current browser access application.
- For an introduction to exception tracking in the browser, see Exception Tracking Page analysis .
