Operation Analysis
Operation user experience analysis is mainly used to monitor and analyze the response time and availability of the user's click operation on the page. Optimizing the user experience of operation is conducive to improving the conversion rate of key steps of users.
Operation to refers to the operation event composed of Ajax request or page on the page. It can be configured that the operation is composed of one or more Ajax. When the Ajax request is completed, the operation is completed. You can also configure the completion of the FCP, LCP, TTI, and full load indicators of a page load as the completion of the operation.
Click Web>Action in the left navigation bar to enter the action list page.
List of actions
The operation list displays all operation information collected by JS probe in the statistical period, including operation name, operation times, UV, operation time, operation availability, time consumed by operation request, times of Ajax request, Ajax error rate, average time consumed by server and times of server response.
-
Key action: Click Critical operation the five-pointed star of the column to mark the action as a key action. Click again to unmark as critical.
-
Operation name: click the page name to enter the operation details page.
-
Click the icon in the upper right corner
of the page to customize the header to be displayed.
-
Click the download icon in the upper right corner of the page to export the operation list data in the statistical period to the local in Excel.
Operational analysis details
-
The operation user experience trend chart displays the operation name, operation times, operation time, time consumed by the operation request, and average time consumed by the server, which can be used to judge the current health status of the event and the user experience trend.
-
The time consumption distribution shows the user response distribution of the three indicators of operation time, operation request time and average time consumption of the server, and the number of requests and the proportion of requests in different time consumption intervals.
-
Regional operators: Select Operating time, Operation request time and Server response time in the first drop-down menu on the left to view the response of the above indicators under different regional operators. The right side List of regions displays the operation time and operation times of the Top 10 slowest countries, provinces or cities. The default is to sort by operation time from highest to lowest.

Operational tracking
Operation tracking includes the single sample data of operation, and the list displays the information such as operation time, operation name, public network IP, user ID (the unique user ID customized by the tone listening cloud), session ID (the single session ID customized by the tone listening cloud), province, city, operator, time consumption, operation request time consumption, average server time consumption and metadata.

-
In the drop-down menu in the upper left corner, you can search by user ID, public IP, session ID and device ID, or filter by entering the time interval value.
-
Click after Filter conditions the user-defined dimension to add the user-defined dimension information as the query criteria. For custom dimension configuration, you need to upload custom information first (see Custom Attached Properties), and then configure custom dimension fields in Application Settings>Custom Dimensions>Common Configuration.
-
You can sort the indicators to filter the slow operations to solve them first.
-
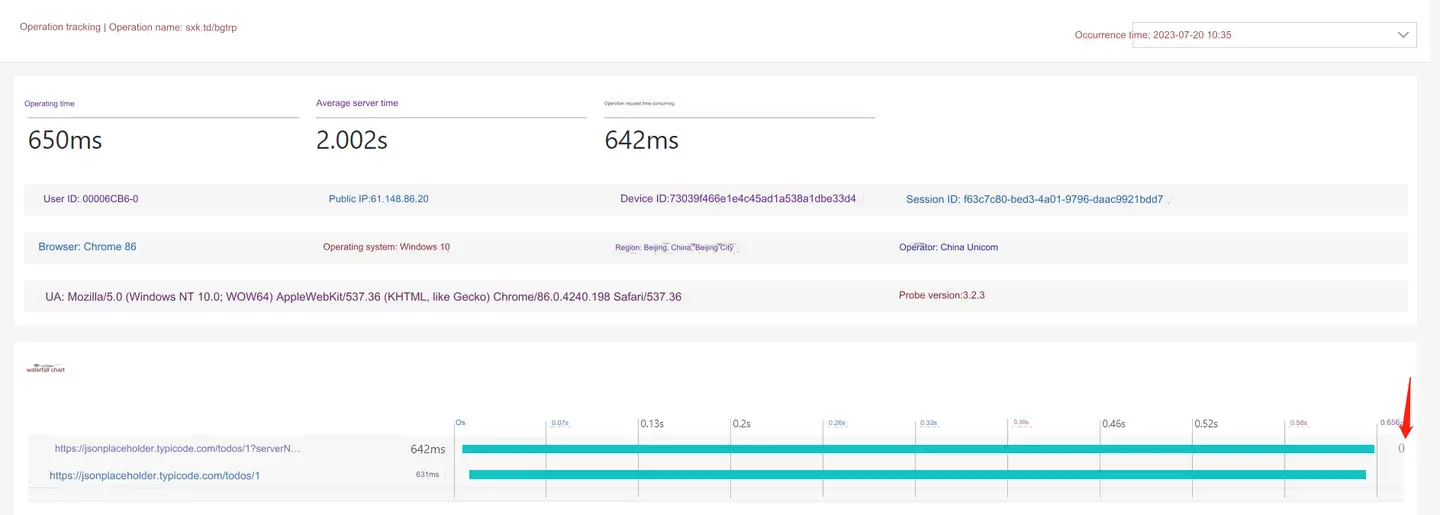
Click the operation name to view the operation details.
If the operation is an Ajax request, the operation time, average server time, operation request time, user ID, public network IP, device ID, session ID, browser, operating system, region, operator, UA and probe version are displayed on the top, and the Ajax request waterfall diagram and the request time of each Ajax can be seen on the bottom. In addition, click
the icon to track down the slow transaction for the Ajax request.
If the operation is a page, the upper part displays the operation time, user ID, public network IP, device ID, session ID, browser, operating system, region, operator, UA and probe version, and the lower part does not display the waterfall chart.
