Page Analysis
Page The analysis provides the performance analysis data of all pages in the application, and can perform performance evaluation, trend chart and quantile chart analysis, region analysis, summary waterfall chart analysis and page exception tracking on the performance of each page.
Click Web>Page in the left navigation bar to enter the Page user experience page and view the list of all pages under the application.
List of pages
The page list displays all embedded pages and performance information under the specified application in the statistical period, Including page URL, page alias, PV, UV, TTFB, FCP, LCP, FID, CLS, full load, TTI, TBT, LoadEventEnd, JS error rate, number of slow pages, proportion of slow pages and number of users affected by slow pages. Sort by PV from highest to lowest by default.

-
Users can retrieve by URI. Input the minimum PV and the maximum PV to filter the pages according to the page PV, which is convenient to sort the TopPV pages according to the indicators.
-
Display host, display URI, display parameters: if only checked Show the host, the page will be displayed according to the domain name aggregation, and the page performance of different domain names can be analyzed; if only checked Show URI, the page will be displayed according to the URI aggregation, which is applicable to multi-tenant, and the same page is deployed in different environments to analyze the page performance; If it is only checked Show parameters , the page will be displayed according to the parameters, which is applicable to pages that differentiate services based on parameters.
-
If the application has a subdomain name, click the right triangle symbol on the left side of the target application in the drop-down menu in the upper left corner of the page, and select the subdomain name to view the performance of all pages under it.
-
Page name: click the page name to jump to the page details page.
-
Click the drop-down menu behind the URL header to select the page type for data filtering, including Page, iframe and All types.
-
Alias: Click Alias the edit icon for the column to give the page an alias that is easy to remember and recognize.
-
Click the triangle behind the header of each indicator to sort by the positive and negative directions of the indicator.
-
Click the download icon
in the upper right corner of the page to export the page list data in the statistical period to the local.
-
Click the icon in the upper right corner
of the page to customize the indicators displayed in the list .
Page analysis details
In the page analysis details, you can view current page performance metric data, page performance metric trends and distributions, geographic and carrier analysis data, aggregate waterfall analysis data, and exception tracking data.
Metric insight
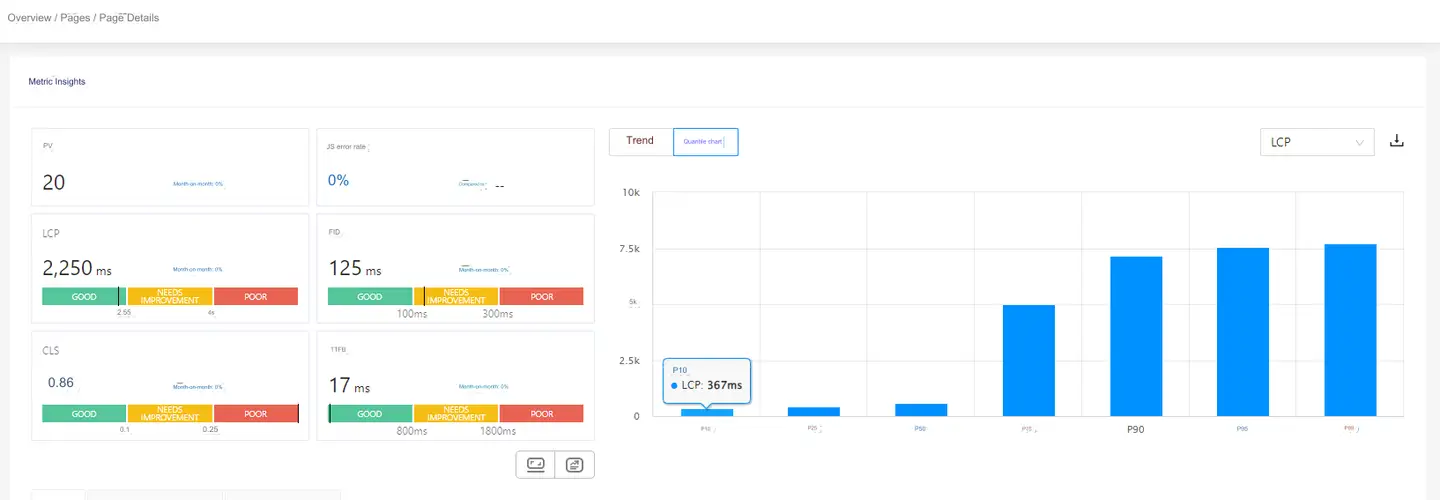
The upper Metric insight left area displays the data cards of PV, JS error rate, LCP, FID, CLS and TTFB indicators applied in the specified statistical period. For instructions on presenting the above metrics, see Metric Description. The data card is described as follows:
-
PV: Displays the total number of visits to the current page in the statistical period and the ring ratio of the previous statistical period.
-
JS error rate: display the JS error rate of the current page in the statistical period and the ring ratio of the previous statistical period.
-
LCP, FID, CLS and TTFB: display the index average value and ring value of the current page in the statistical period. At the bottom of the card, the evaluation bar chart will be displayed according to the threshold set by the user, so that you can clearly and quickly judge the performance of the page. POOR Indicates a poor user experience, NEEDSIMPROVEMENT indicates that the user experience needs to be improved, and GOOD indicates a good user experience .
Chart analysis
The upper right part shows the trend chart and distribution chart of each indicator on the current page. In the first drop-down menu on the top Trend chart right, you can switch the statistical indicators, including TTFB, LCP, FCP , FID, CLS, TTI, TBT, LoadEventEnd, Full Load, DCL and JS error rate. In the second drop-down menu, you can switch the quantile values to be displayed, including the average value, the 50th quantile value, the 75th quantile value, the 90th quantile value and the 95th percentile value. The average value is displayed by default.
After switching to the Quantile map tab, you can view the 10th, 25th, 50th, 75th, 90th, 95th and 99th percentile values.
Regional analysis
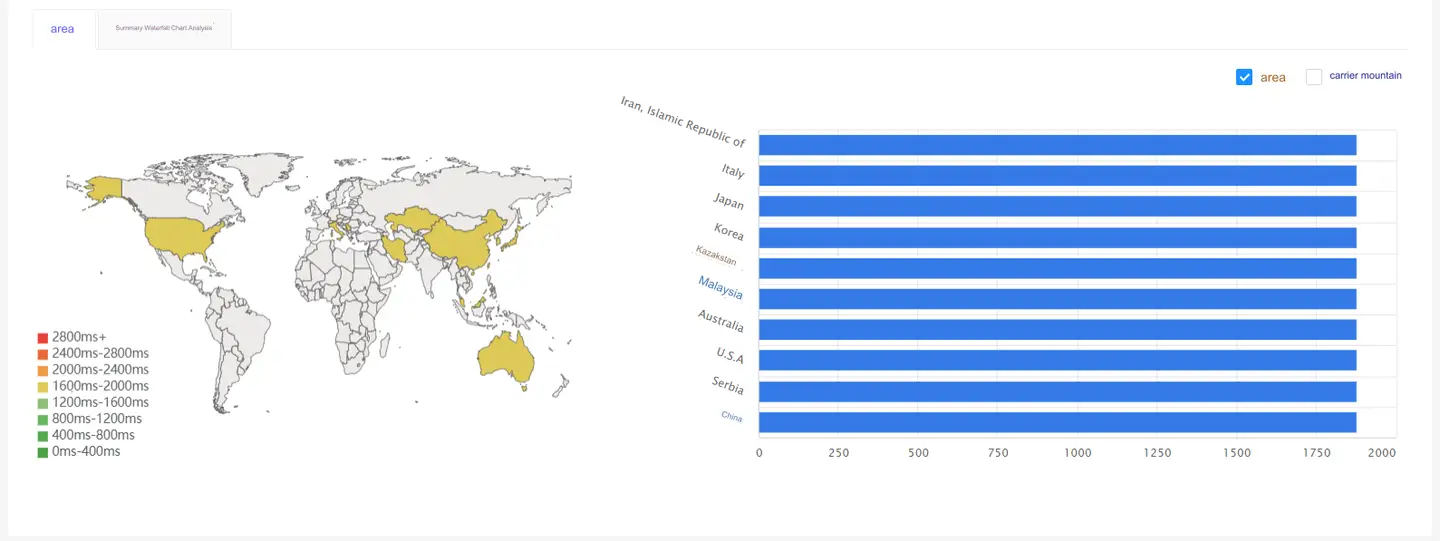
The middle Region tab displays the specific data of the above selected indicators in each province and city in the form of a map. The color will change from light to dark according to the increase of the value. The user can quickly locate the province or city with problems. The right side displays the top 10 provinces or cities of the indicator by default, and the check box in the upper right corner Region is checked by default. If the check box is checked ** Operator** individually, the top 10 operators in the metric will be shown. If they are all checked, the top 10 regional operators in the index will be displayed.
HTML Load Performance Decomposition
HTML Load Performance Decomposition The figure shows the HTML loading performance breakdown index stack chart of the page, including: Stalled, DNS, connection, SSL, first packet, and remaining packets. It is mainly used to judge whether the network quality is good.
Summary waterfall analysis
Summary waterfall analysis The tab displays the resource analysis card and waterfall chart of the URL of the current page.
Resource analysis
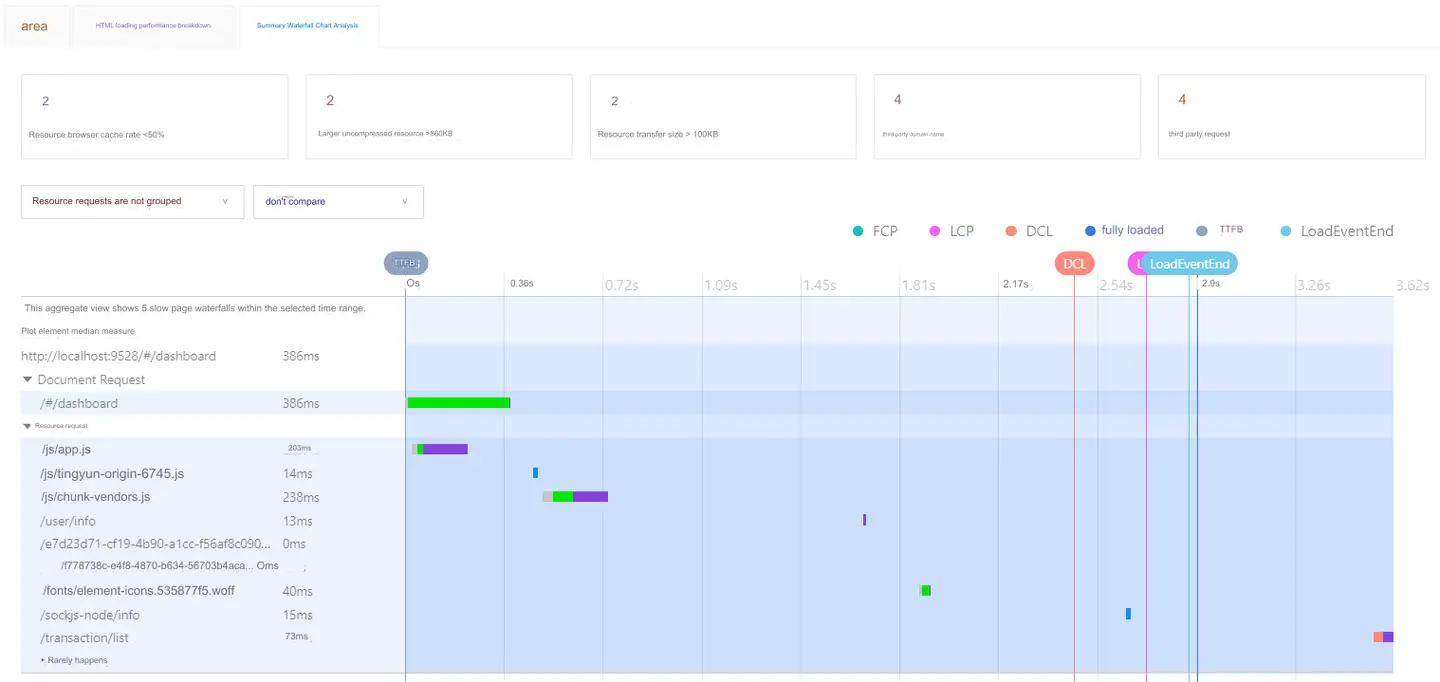
Based on the waterfall chart analysis rules, the system will automatically identify the problem resources that can be optimized, such as uncompressed resources, resources with low cache rate, slow requests, erroneous resources, etc. The relevant rules can be set in the ** Global Settings>Threshold Settings** page.
-
Hover the mouse on the **Number of resource requests for which the Resource Explorer cache rate is less than the * threshold *** card and click in the Details upper right corner to view the resource request URL to improve the resource cache rate, including the total number of calls, the average number of page calls and the cache rate. The default is to sort the total number of calls from highest to lowest. The average number of page calls is the total number of times the resource request is called in the statistical period/the total number of times the current page is called in the statistical period. Click the download icon in the upper right corner to download the URL list locally in Excel format.

-
Hover the mouse over **Number of resource transfer sizes greater than the * threshold *** the card and click in the Details upper right corner to view a large list of resources, including the total number of calls, the average number of page calls, the size of file transfer and the size after decompression. You can pay attention to whether these resources can be split to improve the efficiency of page loading and avoid blocking. The default is to sort the total number of calls from highest to lowest. Click the download icon in the upper right corner to download the URL list locally in Excel format.

-
Hover the mouse over **Number of request error rates greater than the * threshold *** the card and click in the Details upper right corner to view a list of specific requests, including the total number of calls, the average number of page calls, and the request error rate. You can focus on the network or server through these resources. The default is to sort the total number of calls from highest to lowest. Click the download icon in the upper right corner to download the URL list locally in Excel format.
-
Hover the mouse over **Number of same-domain slow requests greater than * threshold *** the card and click in the Details upper right corner to view a list of specific slow requests, including the total number of calls , the average number of page calls, and the time spent on requests. You can analyze whether it is a network problem or a server-side problem. The default is to sort the total number of calls from highest to lowest. Click the download icon in the upper right corner to download the URL list locally in Excel format.
Summary waterfall chart
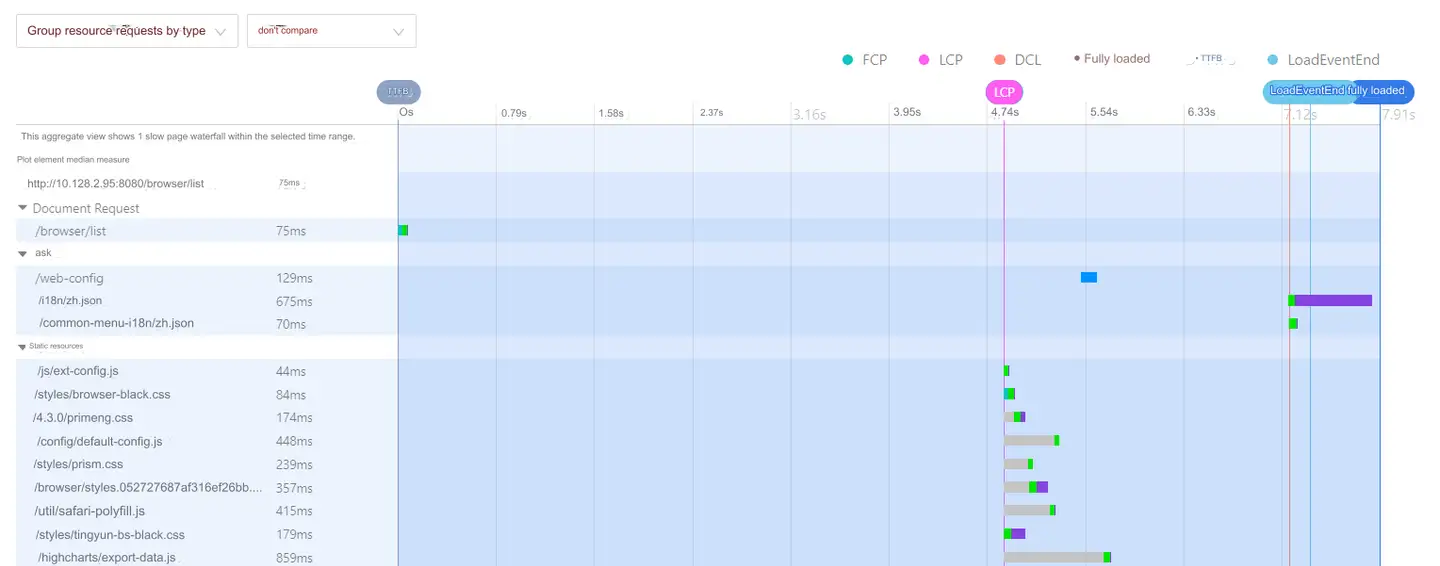
The Waterfall map system aggregates and analyzes the waterfall graphs of each slow page access, and draws a summary waterfall graph according to the rules. On the waterfall graph, you can visually view the median time consumption of the resources/requests called in the slow page. In addition, you can customize the rules to analyze the root causes of performance problems such as cache rate, compression effect, slow requests, resource errors, etc. Summarize the slow pages of the first 1000 corresponding indicators in the waterfall chart analysis, and give the analysis results based on the rules, which can be configured in App Settings>Threshold Settings.
Explain: The elapsed time of the element shown in the aggregate waterfall chart is the median elapsed time of the element in the slow pages analyzed.
The summary waterfall chart shows the median of six indicators in the form of vertical lines, namely, full load, FCP, LCP, DCL, TTFB and LoadEventEnd.
-
Click the first drop-down menu in the upper left corner of the waterfall chart to group resource requests by Type and by Domain. By default, resource requests are not grouped.
-
Resource requests are not grouped: that is, a waterfall graph is drawn in temporal load order.
-
Group the resource requests by type: that is, divide the page resources into three categories: Document Request, Request, and Static Resource, and then draw a waterfall chart for each category according to the time loading order.
-
Resource requests are grouped by domain, that is, they are first grouped by element domain name, then categorized by requests and static resources, and then each category is plotted in chronological load order.
-
-
Click the second drop-down menu to compare the median of each resource request to the previous two hours, the previous day, and the previous week.
-
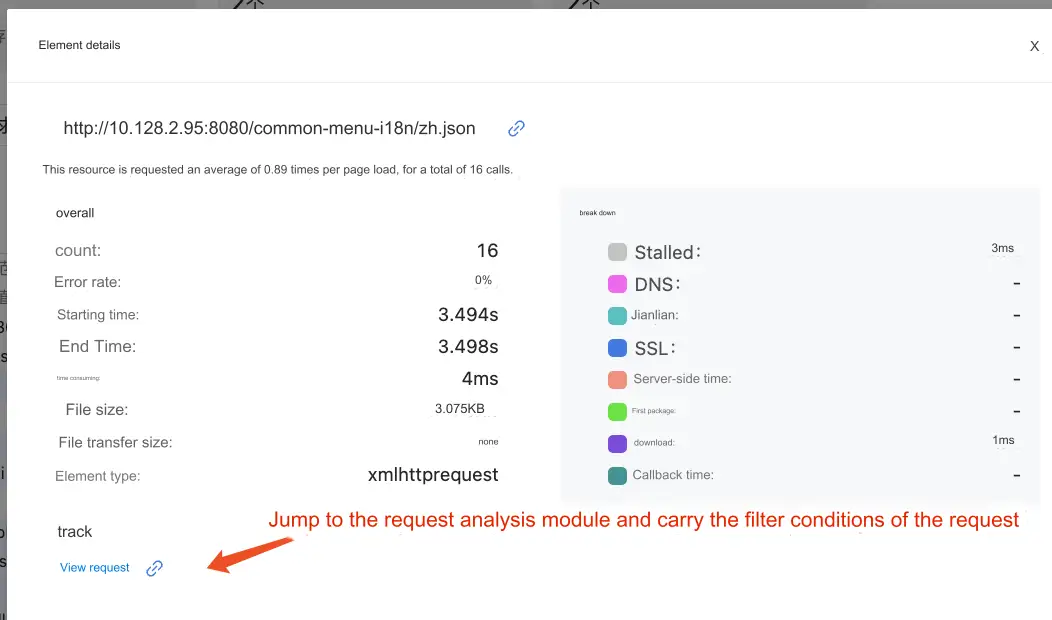
Click a time consumption bar on the right side of the waterfall chart to view the analysis details of the current page element, including overall analysis and request time consumption breakdown. When the element request exceeds the slow request threshold set by you, the part will be displayed Tracking.
- Click the icon after
the element URL to view the contents of the file.
- Click the icon after
-
Below the URL is the average number of times the request was called and the total number of times it was called.
- By breaking down the error rate, time, size, type, and time, you can determine whether the performance of the element affects the overall page load. Click View the request to enter the request analysis page and continue to analyze the response time of the request in the geographical dimension.
Anomaly tracking
Anomaly tracking Show tracking records of every slow load, slow TTI, slow page element, and JS error.
Slow loading
Slow loading The tab displays all page access records that exceed the slow load threshold, including page tracking time, page URL, user ID, session ID, public network IP, region, operator, browser, full load, FCP, LCP , DCL and page metadata.
-
Check Slow full load the, Slow FCP, Slow LCP and Slow DCL check boxes to view page tracking records that exceed the corresponding metric thresholds.
-
In the drop-down menu, you can slow-load records through User ID, Public network IP, Session ID, URL and Device ID queries .
-
Click after Filter conditions the user-defined dimension to add the user-defined dimension information as the query criteria. For custom dimension configuration, you need to upload custom information first (see Custom Attached Properties), and then configure custom dimension fields in Application Settings>Custom Dimensions>Common Configuration.
-
Click the download icon in the upper right corner to download the queried list data to the local in Excel format.
-
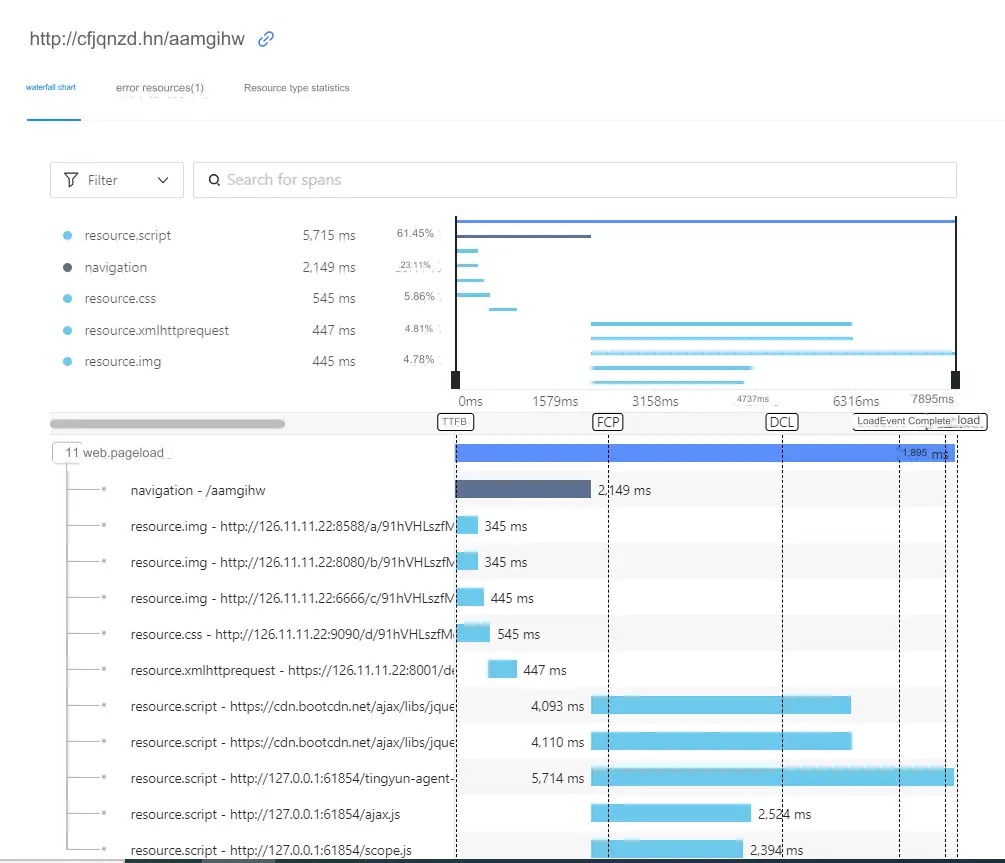
Click the URL in the tracking record to view the waterfall chart, error resource and resource type statistics of this page visit.
-
Waterfall chart: displays resource loading and browser events in the form of waterfall chart. Element types include navigation, CSS, link, script, XML, httprequest, fetch, IMG, iframe, video, icon, and other. The top left shows the legend of each element, the total elapsed time and the percentage of elapsed time. Move the mouse to the right to see the loading waterfall of each element. Move the two black vertical bars to select the display interval of the code segment. The specific code segment and the element waterfall chart are displayed below. The order of the list is based on the time sequence of its occurrence, and the time consumed by each element is provided. Click the drop-down menu in the upper Filter left corner to filter the snippet by element type, followed by the number of elements. Click the bar in the waterfall chart to view element details, including metrics and tracking information.
-
Error Resource: displays the occurrence time and resource path of the error resource.
-
Resource type statistics: display the element request quantity and file transfer size of the page element type and domain name, which can be used to determine whether a certain type of element or domain name causes the slow page. In addition, domain name statistics helps us to determine whether the domain name should be split or merged, so as to avoid the download congestion caused by the browser download concurrency restriction.
-
Core indicators: display the number of TTFB, DCL, LoadEventEnd, FCP, LCP, full load, and resource errors.
-
Navigation Timing: Show Redirect, DNS, SSL, TCP, Request, Response, DOM Processing, LoadEventEnd metrics.
-
Tags: display the UserID, SessionID, operating system, browser, public network IP and UA of the page access.
-
Click the button in the upper right corner Page analysis of the analysis page to enter the Page analysis tool test and generate the page performance analysis report for continuous improvement.
-
Click the button in the upper right corner Open a new page of the analysis page to view the page analysis details in a new page.
-
Click the session ID in the tracking record to enter the session detail analysis page. Please refer to session analysis for details.
Slow TTI
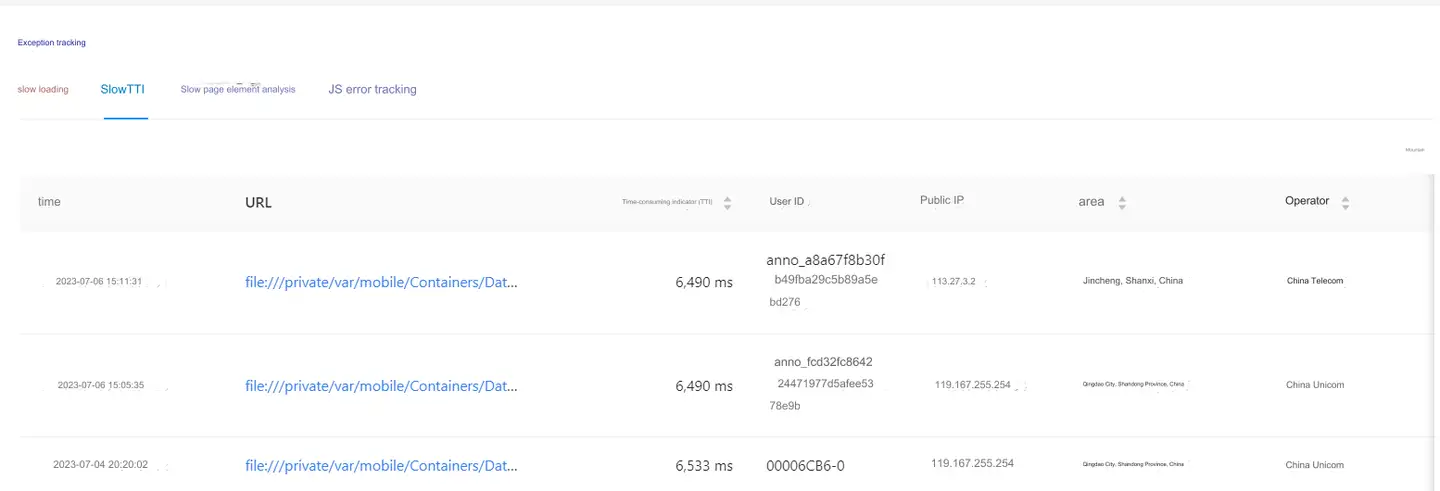
Slow TTI The tab displays all page access records that exceed the slow TTI threshold, including page tracking time, page URL, TTI time, user ID, public network IP, region, operator, browser, and session ID. Click the URL in the tracking record to view the waterfall chart, error resource and resource type statistics of this page access. For details, please refer to Slow Loading. Click the session ID in the tracking record to enter the session detail analysis page. Please refer to Session Analysis for details. Click the download icon in the upper right corner to download the list data locally in Excel format.
Slow page element
Slow page element Tracking is to collect all the elements in the slow page that take more time than the slow request threshold and classify them according to the domain name, and sort them based on the number of element calls, the size of the element, the average time consumption and the number of errors, which can help developers quickly check whether the elements under some domain names or some individual elements cause the concentration of slow pages. In Element type the drop-down menu after the column, you can filter the page elements by element type, including CSS, link, script, XML HTTP request, fetch, IMG, iframe, video, icon, and other. Click the download icon in the upper right corner to download the queried list data to the local in Excel format.

JS error tracking
JS error tracking Display all JS errors of the page, including error information, page address, error PV, browser where the error occurs, error handler and processing status, which can help developers quickly track the details of errors occurring in JS execution and assist developers to reproduce and solve JS errors. Click Error Information to view the error details. For detailed instructions, see JS_error. Click the Export button in the upper right corner of the list to export the list data to the local in Excel.