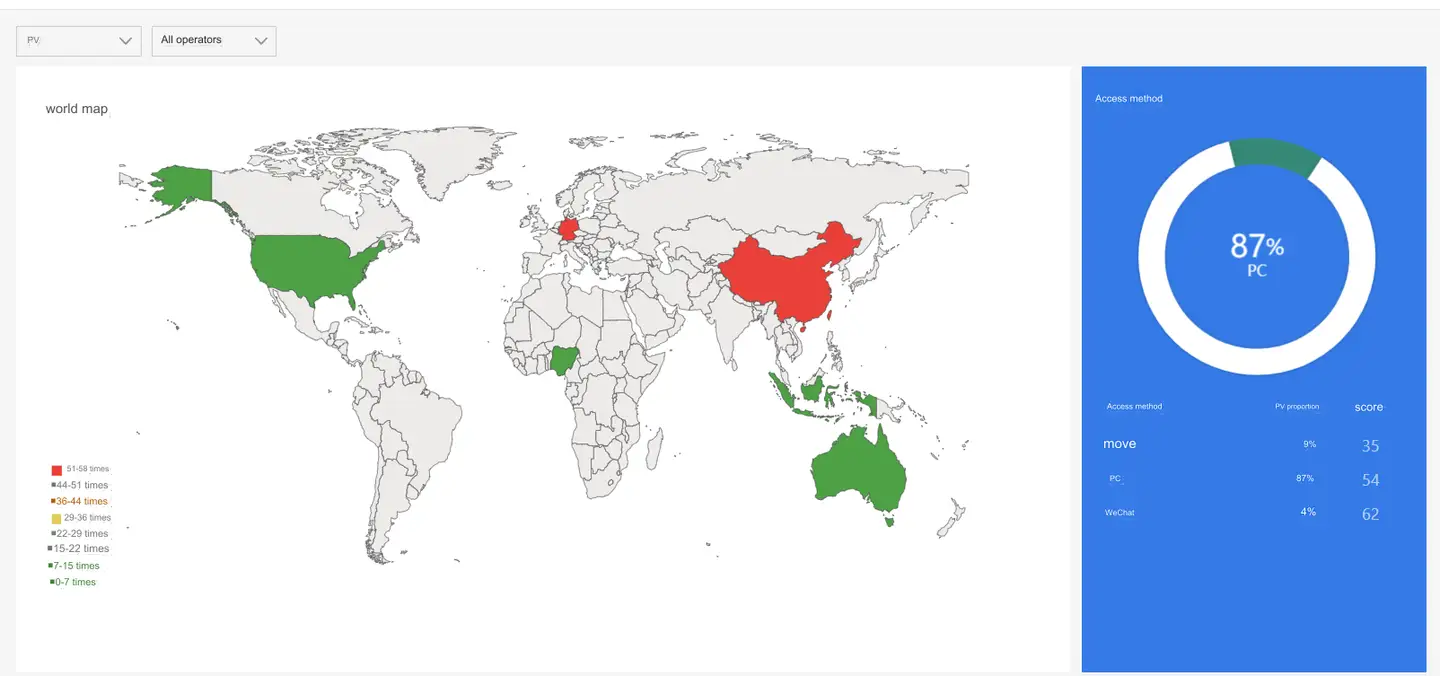
Region Analysis
The regional operator analysis module can see the trend of PV, UV, user experience score, slow page ratio, FCP, LCP, DCL, full loading, operation time, operation availability, number of operations, HTML loading, DNS, connection establishment, SSL , first package, remaining package, JS error rate and other indicators corresponding to the application under different regional operators. Customers can timely adjust and optimize the performance in different regions based on this data, so that users can get the best application user experience in different regions and different network environments.
Click Web>Geography in the left navigation bar to enter the geographic user experience analysis page.
Chart analysis
In the two drop-down menus at the top left, Users can choose to display the statistical data and indicator trend charts of PV, UV, user experience score, slow page ratio, FCP, LCP, DCL, full loading, operation time, operation availability, number of operations, HTML loading, DNS, connection building, SSL, first package, remaining package, JS error rate and other indicators under operators in different regions.

When an indicator is selected, the system will display the color corresponding to the indicator value on the map based on the indicator value. The color configuration can be modified in the settings. For details, please refer to application settings.
Indicator trend chart Show the overall trend of the selected indicator.
Trend Chart of User Experience Indicators Display the time relationship and change trend of FCP, LCP, DCL, slow page ratio, operation time and operation availability. The average, 95th, 90th, 75th and 50th percentiles can be toggled in the upper right corner.
List of regions Display the indicator values corresponding to different regions, including region name, user experience score, PV, UV, operation times, slow page ratio, LCP, FCP, DCL, operation availability and other indicators. The default list is sorted by PV, or by clicking the sort button after each indicator. Click the icon in the upper right corner to customize the header.

TOP5 Operator Indicator Trend Chart Displays the indicator change trend of the top 5 operators in the selected indicator in the statistical period.

Anomaly tracking
For the introduction of anomaly tracking under the region, please refer Page analysis to Anomaly Tracking.