Page Analysis Tool
The page analysis tool is implemented by Google's open source automation tool Lighthouse to improve the quality of web applications. When Lighthouse is given a URL to analyze, it runs a series of tests against the page and then generates a report on the performance of the page. Users can refer to the failed test to see what can be done to improve the application.
Analyze the URL
To analyze the performance of a URL for a Web site, follow these steps.
-
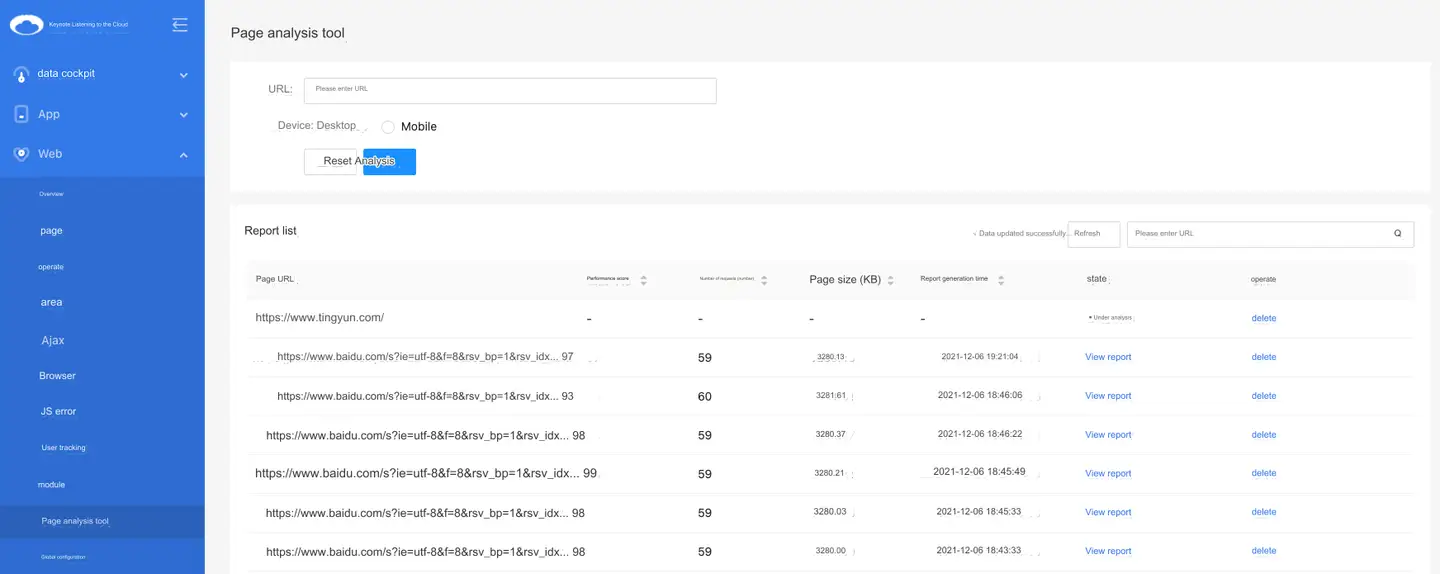
Select Web>Page analysis tool in turn in the left navigation bar to enter the page analysis tool page.
-
Enter the URL of the page to be analyzed in theWebsite text box.
-
Please select Desktop when analyzing PC (desktop) web pages, and select Mobile when analyzing mobile web pages.
-
Click Analysis the button to analyze.
The page URL is queued for analysis and is shown in the report list below.

List of reports
The report list shows the page URL, performance rating, number of requests, page size, report generation time, and status.
-
Status: including In line, Under analysis, View the report, and Analysis failed four analysis statuses. When the page analysis is completed, click View the report to view the analysis report details.
The report list automatically refreshes every 5 seconds to update the analysis status. Users can also click the button in the upper right corner Refresh of the report list to view the latest analysis results.
-
In the search box in the upper right corner of the report list, you can perform a fuzzy search for analysis reports by URL keywords. Click
or press Enter to view the search results.
-
Click Operation the button of the Delete column to delete the analysis report.
Explain: As multiple users may use this function at the same time, it may take a long time to view the report. It is recommended to submit the analysis first and view the analysis results later.
Report description
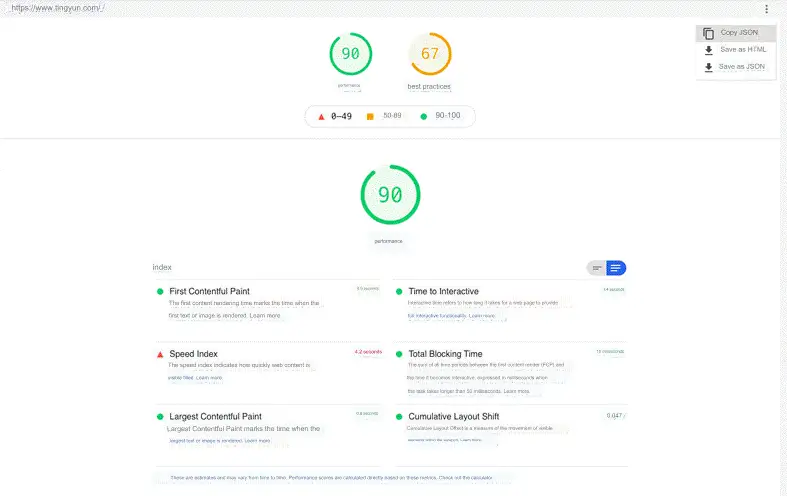
The report will present both Performance and Best Practice ratings, with analysis reports and optimization recommendations, respectively.Click in the upper right corner to export the report as an HTML file and a JSON file. Click Copy JSON to copy the current report content to the clipboard in JSON format.

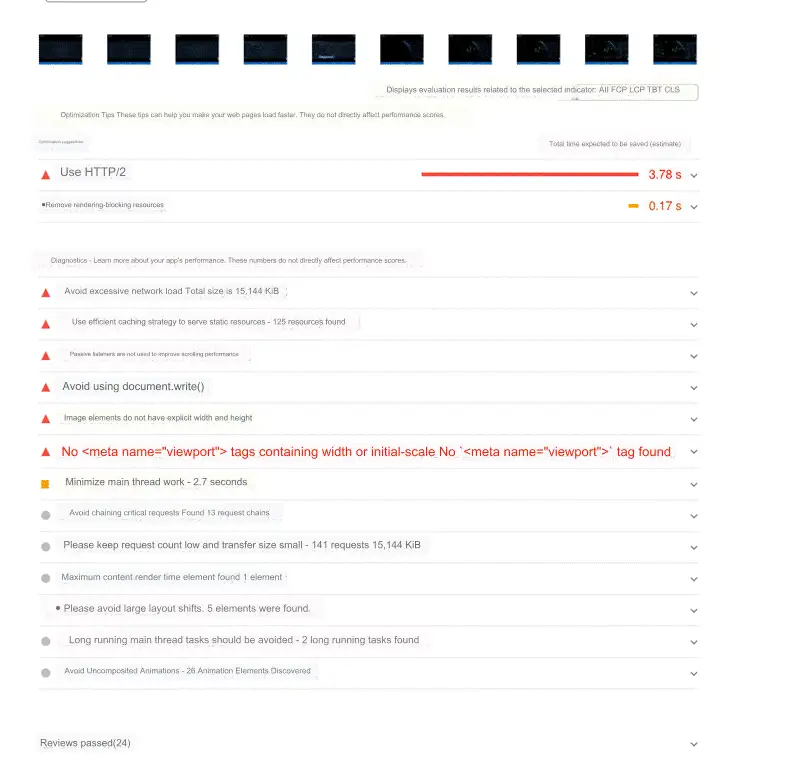
The performance score is a comprehensive score based on six indicators. First Contentful Paint (FCP), Time to Interactive, Speed Index, Total Blocking Time (TBT), Largest Contentful Paint (LCP) and Cumulative Layout Shift (CLS). The report will present Page load process, Optimization recommendations, Diagnostic results, and Approved Audit several modules. IT personnel can refer to these modules for page transformation and optimization to improve page performance.

Best practices will show Trust and security, Browser compatibility, Routine and Approved Audit several modules that IT staff can refer to for page transformation and optimization to improve page quality.