User Tracing
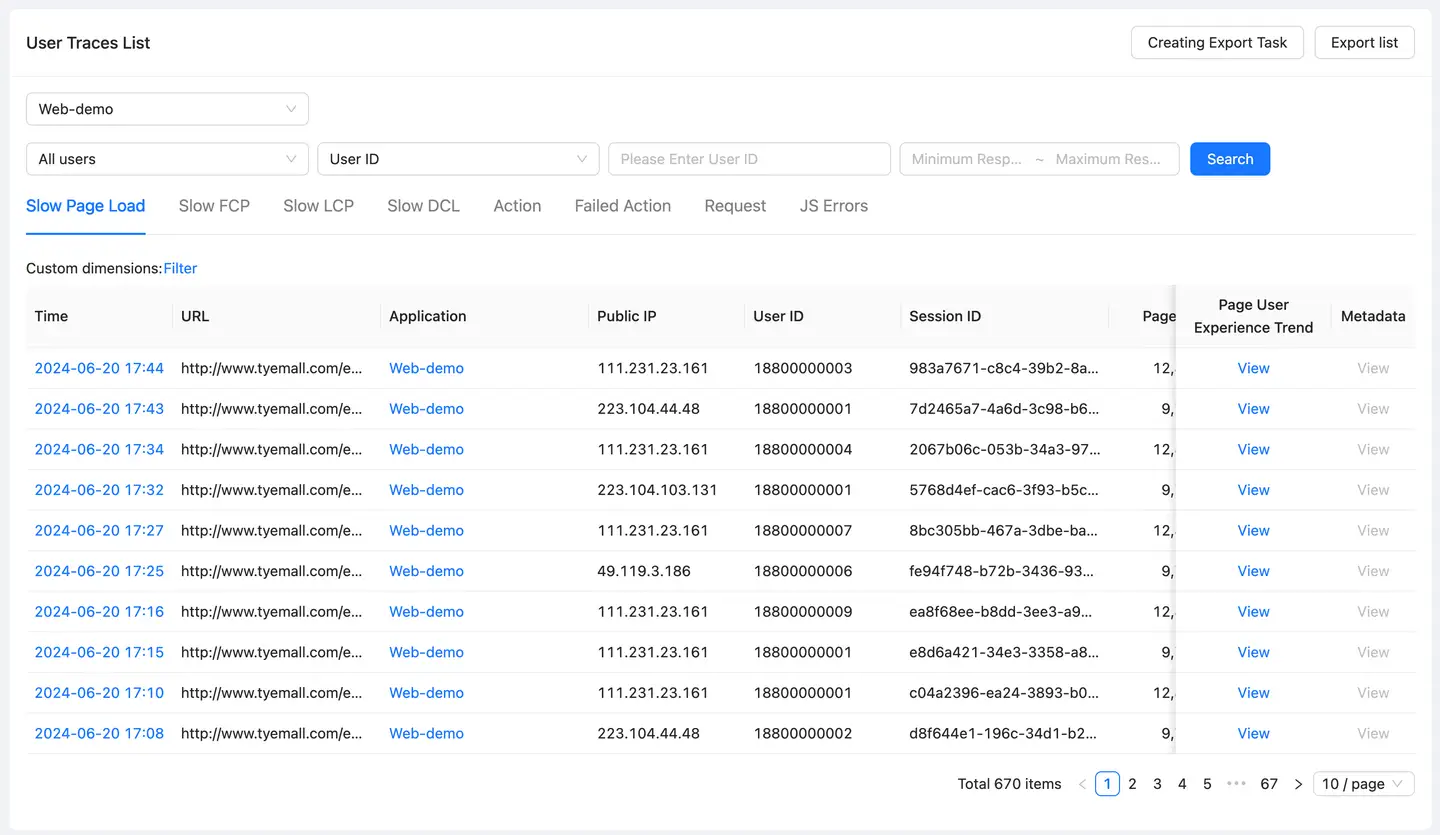
User tracing can filter abnormal data based on all users, VIP user group and all VIP users, and then trace the access records of slow full load, slow FCP, slow LCP, slow DCL, operation, failed operation, request and JS error of users through public network IP, user ID, session ID, device ID and JS TraceID. It can also restore the scene of the situation and analyze the root causes of poor user experience.
Explain: Users can configure VIP users in Alarm > Configuration > List of VIP users.
Click Web>User Tracking in the left navigation bar to enter the User tracking page. On this page, the user can do the following:
- Click the URL of slow full load, slow FCP, slow LCP and slow DCL pages to view the waterfall chart, error resources and resource type statistics of this page access; click the operation name of operation and failed operation to view the operation analysis details ; click the error information of JS error to view the error details.
- Click after Filter conditions the user-defined dimension to add the user-defined dimension information as the query criteria. For custom dimension configuration, you need to upload custom information first (see Custom Attached Properties), and then configure custom dimension fields in Application Settings>Custom Dimensions>Common Configuration.
- By default, Tingyun Web displays the tracking records of all applications. Select the specified application from the application drop-down menu in the upper left corner of the page to filter the data of a specific application.
- Click the New Export Task button in the upper right corner of the page to export all the abnormal single samples in the selected time period. As the data volume may be large, you can wait for a period of time, and then click ** Export the list** the button to enter Export the list the page to download.
- In the JS error tab, check the Show ignored JS errors box in the upper left corner of the list, and the system will display the tracking records of the JS errors that have been filtered out. Check JS error the box to see only the statistics for JS errors. Check Custom error the box to view statistics for custom errors only.
